U.S. Crude Production Surges in Q1 2017
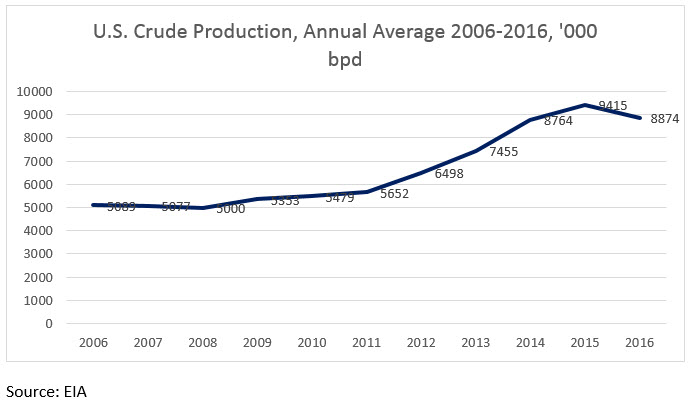
The oil price war took a serious toll on U.S. crude production. According to the U.S. Energy Information Administration (EIA,) the shale boom brought seven consecutive years of output growth between 2008 and 2015, with crude production rising from 5000 kbpd in 2008 to 9415 kbpd in 2015. This equated to an average annual growth rate of 9.5% per year, and added 4415 kbpd to U.S. output. Between 2015 and 2016, production dropped by 541 kbpd (5.7%.) Although prices had been weak for two years, production had continued to rise for a time from projects already underway, but as prices continued to languish, more wells were left uncompleted.
The year 2016 brought a turnaround, which is easier to see when the EIA weekly data is charted. At the beginning of 2016, crude production was 9219 kbpd. By mid-year, it had fallen to 8428 kbpd (at the end of the second quarter.) This was a huge drop of 580 kbpd. However, the decline slowed thereafter, levelling off in the third quarter and then reversing in the fourth quarter. At the end December 2016, crude production had bounced back by 320 kbpd, reaching 8770 kbpd.
The first quarter of 2017 brought continued growth in U.S. crude production. As of the last week of March, 2017, crude output had reached 9199 kbpd. The success of the OPEC production cut agreement and the cooperation of eleven key Non-OPEC crude producing countries brought a strengthening of crude prices that stimulated U.S. production. Compared to the end of December, 2016, this was a recovery of 429 kbpd, bringing U.S. production nearly back to where it was at the start of January 2016.
This article is part of Crude
Tagged:
MARKET CONDITION REPORT - DISCLAIMER
The information contained herein is derived from sources believed to be reliable; however, this information is not guaranteed as to its accuracy or completeness. Furthermore, no responsibility is assumed for use of this material and no express or implied warranties or guarantees are made. This material and any view or comment expressed herein are provided for informational purposes only and should not be construed in any way as an inducement or recommendation to buy or sell products, commodity futures or options contracts.


