
What’s That: Backwardation vs. Contango?
Once you understand the basics of the NYMEX futures market, it becomes clear that traders aren’t buying and selling a single “WTI crude oil” contract. Instead, they’re trading dozens of contracts across different future months, with most of the activity concentrated in the nearest, or “prompt,” month. When you line those months up, you get what’s known as the forward curve. And in today’s environment, where global events like geopolitical tensions involving Iran can quickly tighten or loosen supply expectations, that curve can shift rapidly. Whether it slopes upward or downward carries real implications for how the market is pricing risk, supply, and demand.
That’s why understanding backwardation and contango, the two primary structures of futures markets, is key to interpreting price signals and anticipating shifts in fuel supply dynamics.
Defining the Terms
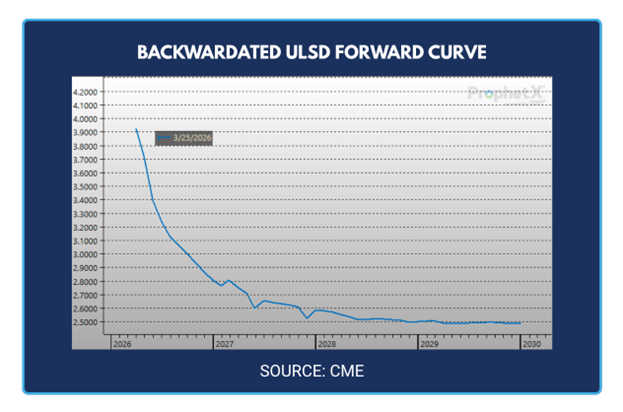
When futures prices are higher than today’s price, and the forward curve slopes upward, the market is in contango. Conversely, when futures prices are lower than today’s price, and the curve slopes downward, it is backwardation. The forward curve reflects the market’s aggregate expectations and constraints; current supply–demand, storage and financing costs, and perceived future risks, rather than a literal price forecast. Traders may expect higher or lower prices ahead, but those expectations are constantly updated as new information and order flow move the curve.
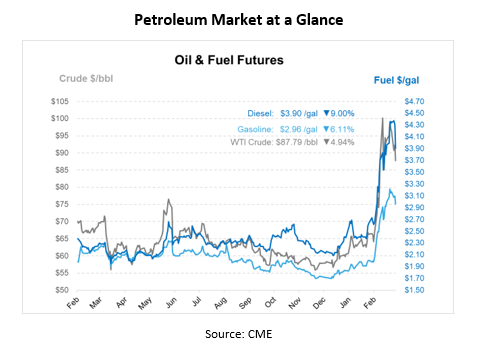
Think about how quickly today’s market is repricing risk. In recent weeks, escalating conflict with Iran and disruptions in the Strait of Hormuz have driven sharp price increases and significant volatility across fuel markets, with diesel and crude both moving higher as tanker traffic slowed and supply routes were threatened. At the same time, periods of steep backwardation are emerging, particularly as prompt supply tightens and near-term barrels carry a premium over future months. But those signals can shift just as quickly, and markets have already pulled back at times as traders weigh reopening shipping lanes, policy responses, and changing demand signals. The result is a forward curve that is constantly adjusting to new information.
What Causes Backwardation & Contango?
Ultimately, the shape of the forward curve is driven by real-time shifts in supply and demand. When prompt supply is tight, the market often moves into backwardation, with higher near-term prices incentivizing immediate production and inventory drawdowns. Conversely, when there is too much supply, the curve tends to shift into contango as prompt prices soften relative to future months. Market sentiment also plays a role, and if the market sees strong demand today but anticipates weaker conditions ahead, such as a potential economic slowdown, it may discount forward prices and reinforce backwardation.
What Does Backwardation Mean for Supply and Prices – Then vs. Now
The direction of the market is extremely important for physical fuel suppliers. In 2022, steep backwardation largely reflected post‑pandemic demand rebounding into constrained supply, including under‑investment, OPEC+ restraint, and Russia‑related disruptions. When futures prices fell below prompt levels, suppliers were strongly discouraged from holding storage and instead drew inventories to sell into the stronger near‑term market, reinforcing tightness and supporting higher prompt prices. At the same time, many financial participants were attracted to the positive roll and curve‑carry available in backwardated structures, though their ability to scale positions depended on margin and volatility rather than price levels alone.
Dan Luther, Vice President of Sales at Mansfield, recently shared his perspective on backwardation during the latest FUELSCast podcast episode. He explained that while backwardation can reflect different market dynamics, current conditions point to supply tightness. “Backwardation is telling the market supply is tight right now, and the product needs to move immediately,” he said. In this environment, storage is discouraged, and supply is pushed into the market, a dynamic that supports stronger near-term pricing.
Ongoing tensions involving Iran and broader Middle East instability have introduced a significant, and so far persistent, risk premium into nearby prices, keeping prompt barrels elevated and forward curves highly sensitive to disruption headlines. In this environment, many suppliers are operating with greater caution, shorter effective planning horizons, and more abrupt adjustments to purchasing and inventory strategies as they respond to sharp swings in flat prices and spreads. For traders, backwardation can still be attractive for curve‑slope and roll‑related strategies, but participation has become more tactical, with a sharper focus on risk limits amid elevated volatility, policy uncertainty, and macroeconomic cross‑currents.
How Can I Use This to My Advantage?
While the forward curve is constantly moving, it gives fuel buyers a valuable planning tool: the ability to lock in prices for future periods using financial hedging strategies tied to futures. When the market is in backwardation (often seen when near‑term prices are elevated by tight supply or risk premiums), fleets can secure future prices that are lower than today’s spot market. This is not a way to “beat” the market, but it can help smooth fuel costs over time, reduce exposure to price spikes, and align your effective cost closer to the average level implied by the forward curve. Explore how this might fit your budget and risk tolerance by connecting with a risk management specialist at Mansfield today!
This article is part of Daily Market News & Insights
MARKET CONDITION REPORT - DISCLAIMER
The information contained herein is derived from sources believed to be reliable; however, this information is not guaranteed as to its accuracy or completeness. Furthermore, no responsibility is assumed for use of this material and no express or implied warranties or guarantees are made. This material and any view or comment expressed herein are provided for informational purposes only and should not be construed in any way as an inducement or recommendation to buy or sell products, commodity futures or options contracts.

 (1)")
")
