
What Is It Wednesday – The NYMEX
Welcome to our continuing FUELSNews series: What Is It Wednesday. Each week, we’ll pick a fuel industry topic to explain, so you can learn more about the market and what drives it. Want to suggest a topic? Email the author, Alan Apthorp, at aapthorp@mansfieldoil.com.
Fuel markets are constantly in flux, reacting to supply and demand changes that create volatility and uncertainty. Whether you buy fuel at a gas station or order truckloads to your fuel tanks, you’ve experienced those daily price changes. But imagine if the price of fuel changed every single second of every day. That’s the reality for NYMEX fuel prices, where trading occurs day and night. Like the stock market, fuel products are traded publicly and are bought and sold by traders around the world. So what is the NYMEX, and how does it impact our local price of fuel?
What Is the NYMEX
The NYMEX stands for the New York Mercantile Exchange. Founded in 1882, the market began as a commodity exchange where merchants could buy and sell dried fruits, canned goods, and poultry. Over time, it expanded to include agriculture, energy, and metals. Crude oil was the first oil product to trade on the exchange in 1983, with gasoline and diesel joining later. The exchange itself became a publicly traded company in 2006, and was acquired by the Chicago Mercantile Exchange (CME) in 2008. There are other commodity exchanges around the world, notably the Shanghai Futures Exchange and the ICE Futures exchange.
The NYMEX’s most important aspect, in terms of oil products, is its futures market. Every product in the futures market consists of at least 3 key items: what, where, and when.
- What exact product is being traded?
- Where will the product be delivered?
- When will the product be delivered?
The NYMEX and the Forward Curve
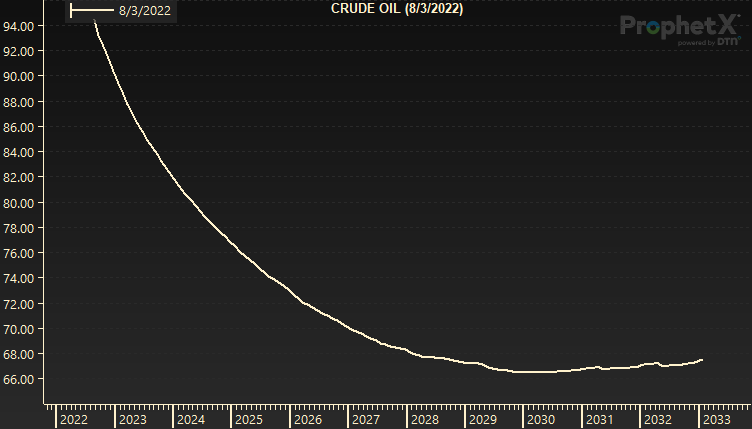
The “when” component is very important, since it allows future prices to be compared to one another. For instance, a trader can choose to trade crude oil based on September 2022 prices, January 2023 prices, or even April 2030 prices. When put together, all these different future products can be charted into a forward curve that shows how the market expects prices to trend. The direction of prices – whether they are rising (contango) or falling (backwardation) in the future – is very important for traders. The below chart shows an example of a steeply backwardated market, meaning the market expects prices to be high in the short-term but fall over time.
NYMEX Energy Products
We’ve covered the three main components of a futures contract – what, where, and when. What are those specifics for energy products?
Crude Oil (CL)
- Product: West Texas Intermediate blend crude, which is light and sweet.
- Location: Cushing, Oklahoma
- When: Product delivered between the first calendar day of the month and the last day of the month
Diesel (HO)
- Product: Ultra-Low Sulfur Diesel
- Location: New York Harbor, NY
- When: Product delivered between the day after the 5th business day of the month and the day before the last business day of the month.
Gasoline (RB)
- Product: RBOB (Reformulated Blendstock for Oxygenated Blending, or lower-emission gasoline not containing ethanol)
- Location: New York Harbor, NY
- When: Product delivered between the day after the 5th business day of the month and the day before the last business day of the month.
How Does the NYMEX Relate to My Local Price?
The NYMEX market sets the tone for all fuel markets in the US. Refiners often trade their products at a differential to the NYMEX, called basis. For instance, a refiner in Houston might sell gasoline to a bulk fuel supplier like Mansfield at RB minus five, meaning five cents under the NYMEX. Basis can be more or less than the NYMEX, since regional prices are impacted by their own supply and demand, but the foundation is always a NYMEX price.
Regional “spot” prices (regional prices, reflected in reports such as the OPIS Spot, Platts, and Argus) set the tone for local prices (reflected in reports such as OPIS Rack and DTN Rack). For instance, if the Gulf Coast region is trading five cents under the NYMEX, Baton Rouge, LA might have prices two cents higher than the spot price. This is called the netback, which like basis can be positive or negative and is based on pipeline fees, transport, and pipeline shippers’ margin.
Anywhere in the US, your local price of fuel is a combination of NYMEX prices and basis and netback differentials. There isn’t always a perfect correlation – some markets may even see their local prices move in the opposite direction of the NYMEX, such as Midwest diesel prices during the fall harvest season. Still, the NYMEX always sets the tone. A significant change in NYMEX prices will almost always trickle through to prices around the country. For that reason, it’s important to watch NYMEX prices to understand exactly what’s going on in the fuel market.
This article is part of Daily Market News & Insights
Tagged: crude, crude prices, Daily Market News & Insights, diesel, gasoline, oil prices, The NYMEX
MARKET CONDITION REPORT - DISCLAIMER
The information contained herein is derived from sources believed to be reliable; however, this information is not guaranteed as to its accuracy or completeness. Furthermore, no responsibility is assumed for use of this material and no express or implied warranties or guarantees are made. This material and any view or comment expressed herein are provided for informational purposes only and should not be construed in any way as an inducement or recommendation to buy or sell products, commodity futures or options contracts.

 (1)")
")
