
What Is It – PADD 1
Every fuel market in the US is unique, with it’s own supply and demand trends. Yet markets in close proximity to one another tend to share similar characteristics. The government groups similar markets into five PADDs, with each one showing unique fuel supply and demand dynamics. By understanding each market in more detail, we can glean a better understanding of the market’s function as a whole. Today, we’ll take a deeper dive into PADD 1 and its supply trends.
What is PADD 1
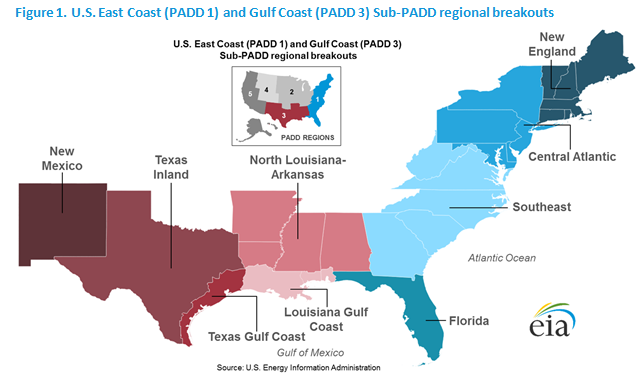
PADD 1 represents the East Coast of the United States. It is the only PADD to be divided into sub-PADDS, each with its own set of unique challenges. In the map below, PADD 1 includes all the Blue states, with New England designated PADD 1A, the Central Atlantic deemed PADD 1B, and the Southeast and Florida grouped together as PADD 1C
What Makes PADD 1 Unique?
PADD 1 is unique in that it is almost entirely reliant on fuels imported from other regions. In a region that consumes almost half of the US’s daily fuel demand – over 200 million gallons per day – only 15% (33 million gallons, or 0.8 MMbpd) are produced within the region. The PADD receives a large chunk of its supply from just two pipelines – the Colonial Pipeline and the Plantation Pipeline. In the northern areas, fuel is also imported from other countries, mainly Canada and Europe.
As the map above shows, there are very few refineries (yellow dots) anywhere in PADD 1. Refinery throughput has been cut in half over the past decade, with economic hardship and surprise maintenance taking several refineries offline over time. Once boasting over 20 refineries, the East Coast now has only 7.
The “Up-Down” Spread
The region is also unique in its geographic expanse. Spanning 1,980 miles from the tip of Florida to the peak of Maine, there are many fuel differences. The southern areas are quite close to Gulf Coast refiners, and rely heavily on their supply. Farther north, where a pipeline shipment from Houston could take weeks, barge imports into New York Harbor are more common, as are pipeline imports from Canada. This leads to some big differences in how each region buys.
The geographic distance, and different buying, creates what’s know as the “Up-Down”, or the difference between Gulf Coast prices and New York Harbor market prices. The wider the spread (eg, New York prices are much higher than Gulf Coast), the more product is pulled northward. When the spread is narrow, shippers flood product into the Southeast and abandon the Northeast entirely. Although this dynamic isn’t one that most retail consumers need worry about, sophisticated buyers may notice an impact on regional supply, basis, and local rack prices (where local price changes are called “netbacks”).
Let’s Meet the PADDs
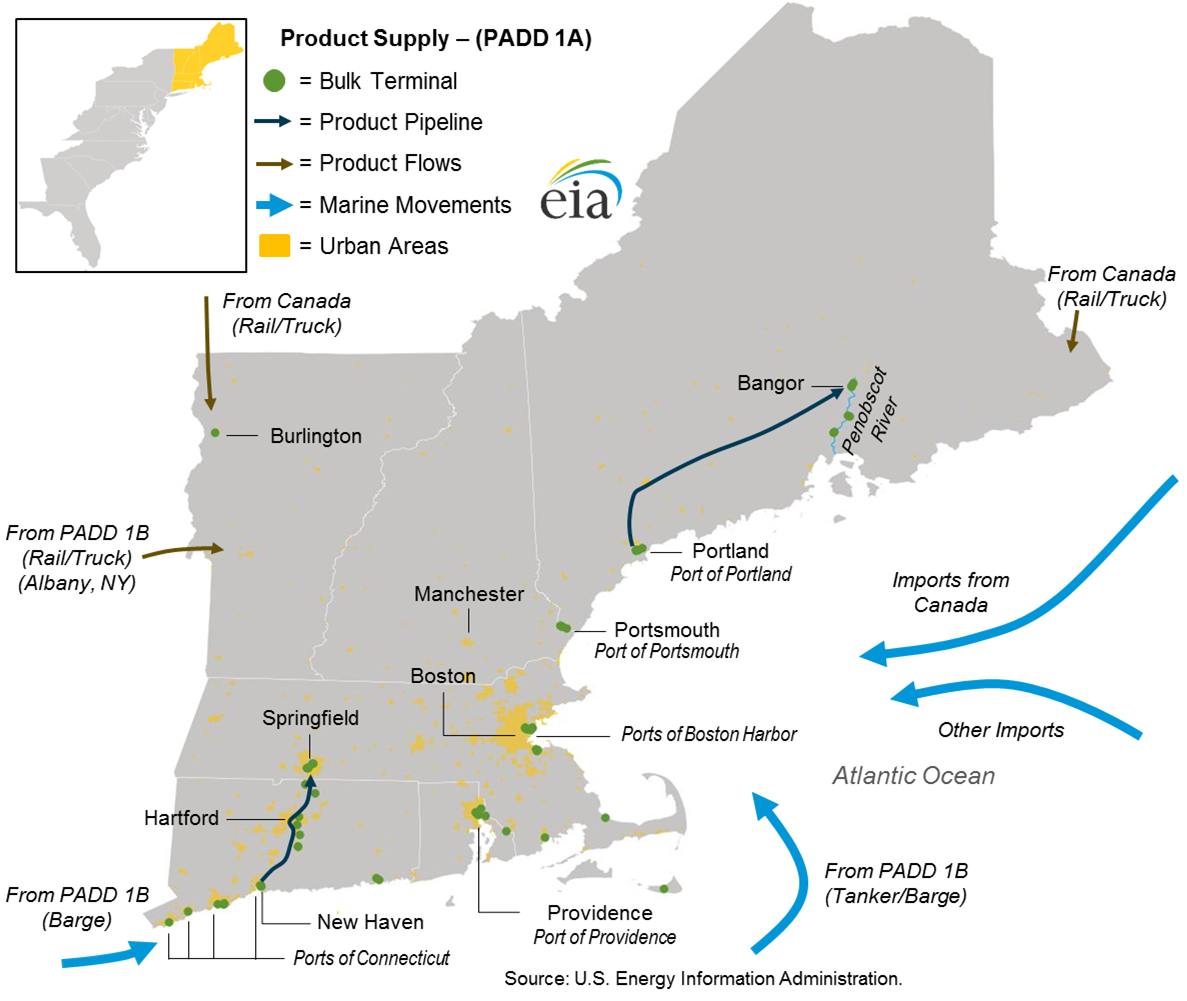
Way up north, PADD 1A (New England) is almost entirely dependent on foreign imports for its oil. Note in the map below that nearly all product is coming by rail/truck from Canada or by barge import from Canada and Europe. Cargo ships from the New York Harbor may also make their way northward.
Because PADD 1A is very dependent on foreign imports, its prices are highly connected to international rates. Calls for a US export ban bode poorly here, since reciprocal action from other countries would leave them without any supply options.
PADD 1B, the Central Atlantic is much more complex than its northern neighbor. The region relies heavily on imports into New York Harbor, but also has a variety of other avenues for supply. Notably, it can receive product from the Chicago (PADD 2) markets via pipelines into Pittsburgh. Even more, the region benefits from supply coming from the Gulf Coast via the Colonial Pipeline, which terminates in Linden, NJ.
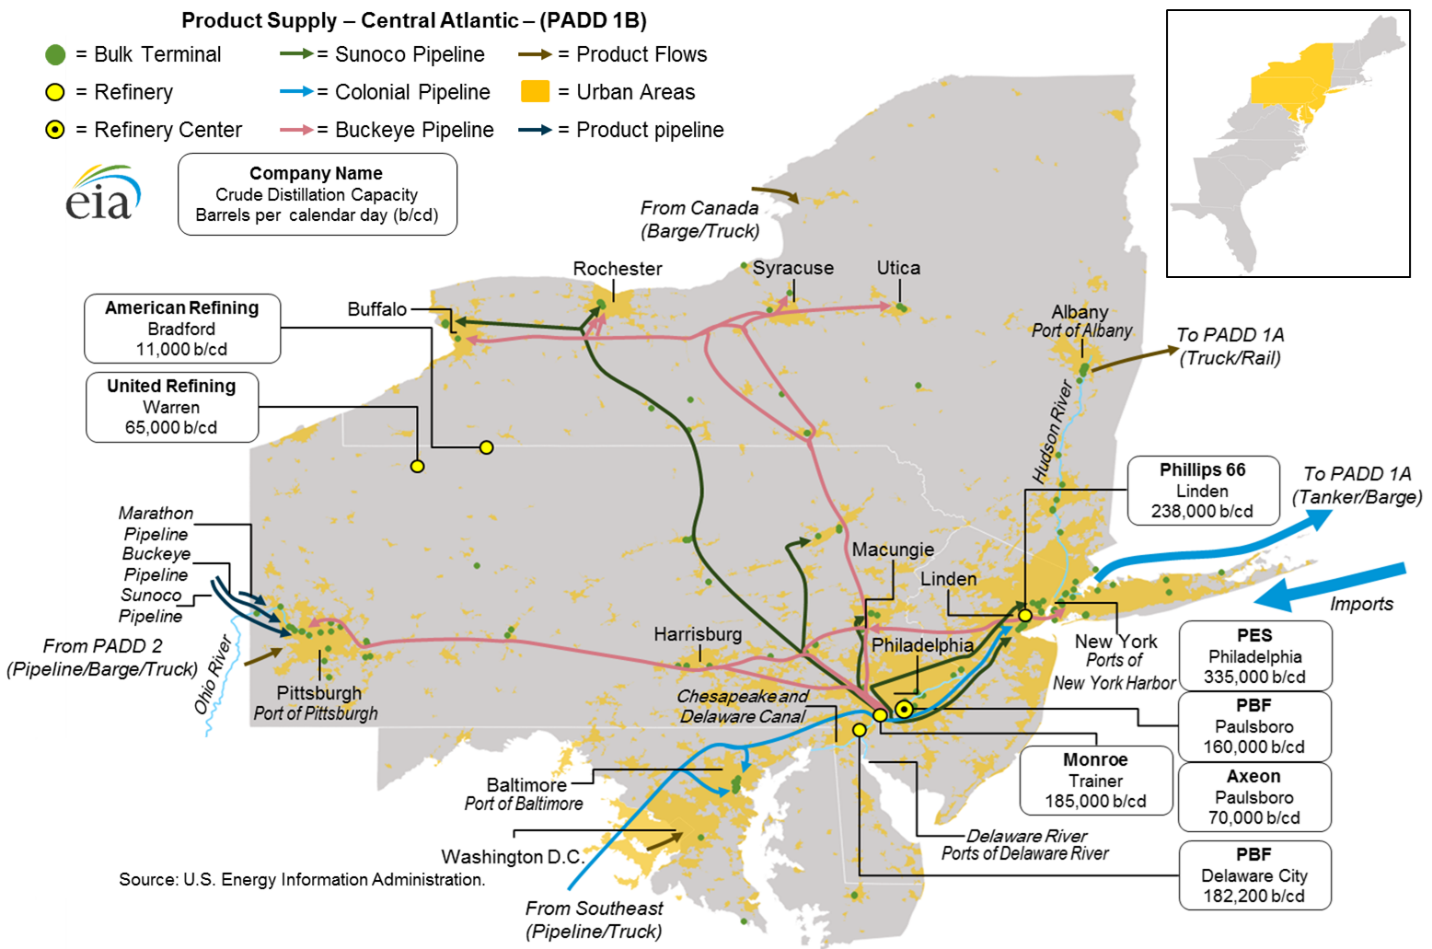
PADD 1B even has its own local refineries, which convert foreign crude oil into domestic fuels. In fact, PADD 1B is the only sub-region along the East Coast to have its own refineries, giving it some flexibility from a supply standpoint. However, poor economics, a limited market, and local factors have caused many refineries to close. PADD 1B now produces just half as much fuel as it did 15 years ago.
Like New England, the Central Atlantic area receives significant product volumes from overseas, so an export ban would mean less supply coming into the region. It’s also reliant on certain pipelines – so the Colonial Pipeline cyberattack in 2021 caused challenges all the way into New York. Overall, the region’s convergence of multiple fuel sources makes arbitrage opportunities quite interesting. Depending on a fuel supplier’s main contracts, they could be focusing just on Gulf Coast supply, or just on imports from Europe. Having a supplier with many connections and diverse supply options is a big bonus in the Central Altnatic.
Down south, PADD 1C (Southeast) is almost entirely reliant on just two pipelines – the Colonial Pipeline and the Plantation Pipeline. Of these two, Colonial ships more volume, so it receives a larger share of attention. It’s also been subject to some major shutdowns in recent years, including a leak in 2016 and a cyberattack in 2021 that cut off supply to the entire PADD 1C area. Although barge imports into some coastal markets like Savannah and Charleston can help during outages, they don’t see nearly enough volume to stem the tide during severe outages.
Florida is worth its own separate consideration. Although included in PADD 1C, only the northern parts of the state receive any shipments from the Colonial Pipeline. The rest of the state – where most of the population lives – is reliant on barge imports from the Gulf Coast. Wind, rain, and other weather conditions can disrupt the flow of to and from Florida, so prices can become volatile when barge shipments are delayed.
This article is part of Daily Market News & Insights
Tagged: crude, Daily Market News & Insights, diesel, diesel prices, energy, fuel, gasoline, PADD, padd 1
MARKET CONDITION REPORT - DISCLAIMER
The information contained herein is derived from sources believed to be reliable; however, this information is not guaranteed as to its accuracy or completeness. Furthermore, no responsibility is assumed for use of this material and no express or implied warranties or guarantees are made. This material and any view or comment expressed herein are provided for informational purposes only and should not be construed in any way as an inducement or recommendation to buy or sell products, commodity futures or options contracts.

 (1)")
")
