

U.S. Crude Oil Production Decreased in 2016
by EIA
Even with a rising crude oil price throughout most of 2016, total U.S. oil production in 2016 was below its 2015 level. However, monthly production began growing in the fourth quarter of the year after declining over its first three quarters. Total production managed to stay above the five-year average thanks to prior year increases. With the removal of restrictions on exports of domestically-produced crude oil at the end of 2015, crude oil exports increased and the difference between Brent and WTI crude prices narrowed, which made crude imports relatively more attractive.
Both Brent and West Texas Intermediate (WTI) crude oil spot prices increased in 2016. The Brent spot price increased from $31 per barrel (b) in January to $53/b in December, while the WTI spot price increased from $32/b to $52/b over the same period. The increase for WTI was its largest annual price increase since 2009. It appears that the November 2016 Organization of the Petroleum Exporting Countries’ (OPEC) agreement to cut production beginning in January 2017 led prices to rise at the end of 2016 in anticipation of some level of member country compliance with the production cuts.
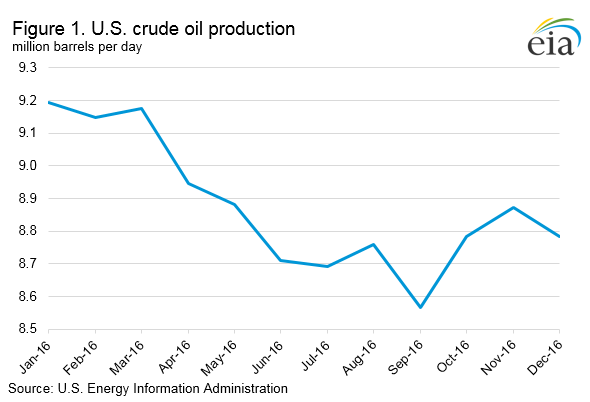
Through the first three quarters of 2016, U.S. crude oil production trended downward, dropping from 9.2 million barrels per day (b/d) in January to 8.6 million b/d in September. In the last quarter of 2016, production began to rise, reaching 8.8 million b/d in December (Figure 1). Average oil production for 2016 was 8.9 million b/d, below the 2015 level of 9.4 million b/d, but still 1.3 million b/d greater than the average annual level over 2011-15, when production was generally rising. Production trends varied significantly across U.S. regions. Notably, production in the Permian Basin increased from 1.9 million b/d in January 2016 to 2.1 million b/d in December. Production in the federal offshore Gulf of Mexico averaged 1.6 million b/d in 2016, the highest annual production ever recorded for that region.
Although U.S. crude oil inventories were already elevated in 2015, they rose even further in 2016, with end-of-year inventories reaching 484 million barrels, 35 million barrels above their end of 2015 level. Inventories grew despite a 14,000 b/d rise in refinery inputs from 2015 to 16.2 million b/d in 2016.
Crude by rail movements in the United States (including rail shipments to and from Canada) averaged 477,000 b/d in 2016, down 277,000 b/d from 2015, a 37% reduction. Shipments of crude oil by rail from the Midwest (PADD 2) to the East Coast (PADD 1) accounted for 77% of the decline, dropping an average of 212,000 b/d from 2015 to 158,000 b/d in 2016. Declining production in the Midwest, expansions in pipeline capacity, and more attractive imports due to narrowing crude price spreads all contributed to reducing movements of crude by rail.
Total U.S. crude oil imports grew to 7.9 million b/d in 2016, nearly 515,000 b/d higher than in 2015. Narrower spreads with international crude prices made importing more attractive in 2016 compared with the previous year. The Brent-WTI spread averaged $4.82/b in 2015 and dropped to $0.87/b in 2016. East Coast (PADD 1) imports made up nearly half of the total U.S. import growth, climbing 242,000 b/d to average 865,000 b/d for the year. As in 2015, the Gulf Coast (PADD 3) accounted for the largest volume of imports, averaging 3.1 million b/d, but increased only 183,000 b/d from 2015.
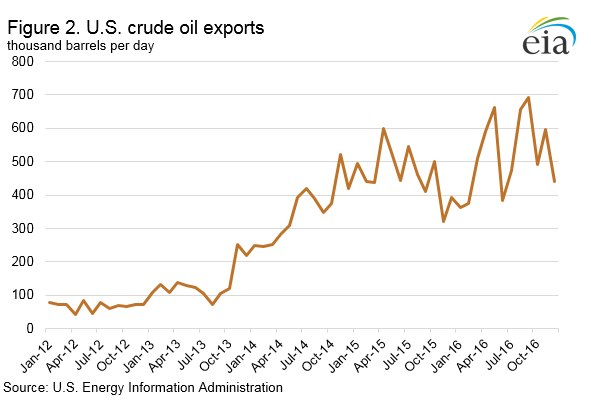
In 2016, the first full year with no restrictions on exports of domestically-produced crude oil, U.S. crude oil exports averaged 520,000 b/d, 55,000 b/d (12%) higher than in 2015 (Figure 2). However, with recent declines in U.S. crude oil production, the rate of U.S. crude oil export growth has slowed significantly from its pace over 2013-15 notwithstanding rising U.S. crude oil imports that substituted for some domestic crude use at U.S. refineries.
Prior to the removal of crude oil export restrictions at the end of 2015, nearly all U.S. crude exports went to Canada, which was not subject to those restrictions. After restrictions were lifted, the number of destinations for U.S. crude oil exports increased. In 2016, the United States exported crude oil to 26 different nations compared with 10 different nations in 2015. Canada remained the top destination for U.S. crude oil exports in 2016, receiving 301,000 b/d, 263,000 b/d greater than the Netherlands, the second largest destination.
This article is part of Crude
Tagged:
MARKET CONDITION REPORT - DISCLAIMER
The information contained herein is derived from sources believed to be reliable; however, this information is not guaranteed as to its accuracy or completeness. Furthermore, no responsibility is assumed for use of this material and no express or implied warranties or guarantees are made. This material and any view or comment expressed herein are provided for informational purposes only and should not be construed in any way as an inducement or recommendation to buy or sell products, commodity futures or options contracts.


