Oil companies’ proved reserves decline for second consecutive year as finding costs remain near historical average
Information in the 2016 annual reports of 68 publicly-traded oil companies indicates that their aggregate proved reserves declined in 2016 for the second consecutive year. In addition, reported finding costs—which are exploration and development expenditures per barrel of proved reserves added—remain near their historical average. The decline in proved reserves was heavily concentrated in a few companies that wrote down Canadian oil sands projects. However, low extensions and discoveries also contributed to fewer proved reserves additions. Together, the downward revisions, the amount of oil produced (withdrawn), and the lower extensions and discoveries led to a net decline in reserves.
For the companies included in this analysis, global crude oil and other liquids production averaged 24 million barrels per day (b/d) during 2016. These 68 companies are those oil and natural gas companies that are listed on U.S. stock exchanges, and are required to report their proved reserves every year to the U.S. Securities and Exchange Commission (SEC). Proved reserves are defined as estimated quantities of oil and natural gas that analysis of geologic and engineering data demonstrates with reasonable certainty are recoverable under existing economic and operating conditions. Price changes can have a significant effect on the economic viability of oil projects, and some companies specifically cited low prices in 2016 as a reason to revise their proved reserves base downward.
Three companies contributed the most to of the group’s combined downward revisions of 6.7 billion barrels. Each made downward reserves revisions associated with Canadian oil sands and bitumen projects totaling 1.1 billion barrels, 3.7 billion barrels, and 2.7 billion barrels, respectively. Collectively, Canadian oil sands revisions represented the largest reduction in proved reserves among companies whose 2016 reports were reviewed for any region globally (Figure 1).
While revisions can add or subtract from proved reserves, extensions and discoveries represent newly found quantities of oil, increasing a company’s proved reserves base. Following the crude oil price decline beginning in mid-2014, companies significantly reduced capital expenditures. The largest spending reductions by many companies whose reports were reviewed were in their exploration and development budgets, which likely contributed to lower amounts of proved liquids reserves additions in 2016. Excluding revisions and net purchases of proved reserves from other companies, reserves additions totaled 4.9 billion barrels in 2016. These additions were offset, however, by the large negative revisions and the amount of oil the companies produced, bringing their aggregate net change in proved reserves to a decline of 8.2 billion barrels (Figure 2).
Later this year, EIA will issue an annual report that focuses exclusively on proved reserves located in the United States, including all U.S. producers, whether or not they are publicly traded. The U.S. reserves component of total reserves for the 68 companies whose reports were reviewed here suggests that EIA’s proved reserves report for 2016 will show only modest changes from the 2015 report.
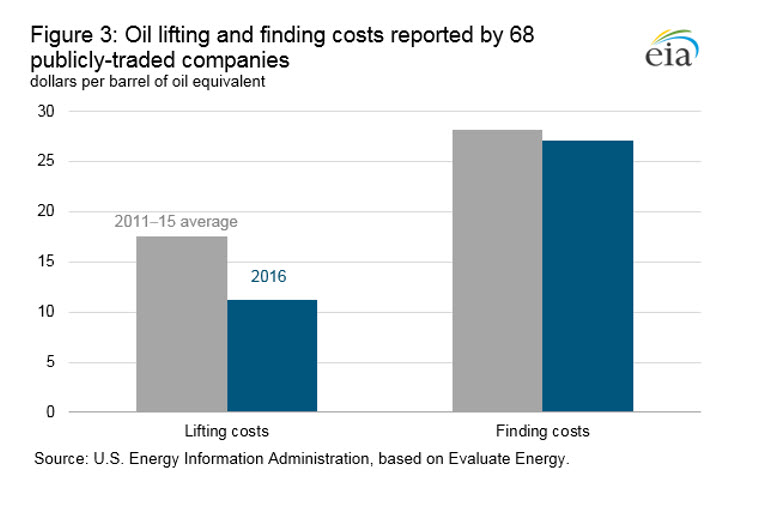
As these companies reduced spending on exploration and development, they focused on extracting additional oil from reserves largely developed in previous years. By directing capital to developed reserves, companies maintained production levels to maximize cash flow, focusing on the most productive and reliable acreage. This approach, together with reductions in costs resulted in lifting costs of $11.24 per barrel of oil equivalent (boe) in 2016, 36% below the 2011-15 average.
The 68 companies spent $247 billion on exploration, development, and unproved reserves acquisitions in 2016, 37% below their 2011–15 average of $390 billion. In addition to the 4.9 billion barrels in proved liquids reserves these companies added in 2016, they added 4.2 billion boe in proved natural gas reserves, bringing the total volume of energy reserves added to 9.1 billion boe, 35% below their 2011–15 average. Unlike the lower costs they realized from producing developed reserves (lifting costs), companies spent almost the same amount per boe to add reserves to their future production base, as the finding cost was $27.07/boe in 2016, only 4% below the 2011–15 average (Figure 3).
So far in 2017, capital expenditures remain lower than for the same period in 2016. Although the U.S. onshore-focused companies in this group increased year-over-year capital expenditures in the fourth quarter of 2016 and first quarter of 2017, larger companies with international operations continued to reduce capital expenditures. Two-thirds of the companies in this group produced less than 250,000 b/d in the first quarter of 2017, with about 60% of these smaller producers increasing their capital expenditures compared with the first quarter of 2016 (Figure 4). In contrast, almost 80% of the group’s larger producers in this set reduced capital expenditures.
For additional oil company financial analysis, see EIA’s Financial Review 2016.
This article is part of Daily Market News & Insights
Tagged:
MARKET CONDITION REPORT - DISCLAIMER
The information contained herein is derived from sources believed to be reliable; however, this information is not guaranteed as to its accuracy or completeness. Furthermore, no responsibility is assumed for use of this material and no express or implied warranties or guarantees are made. This material and any view or comment expressed herein are provided for informational purposes only and should not be construed in any way as an inducement or recommendation to buy or sell products, commodity futures or options contracts.


