

Crude oil and petroleum product exports reach record levels in the first half of 2017
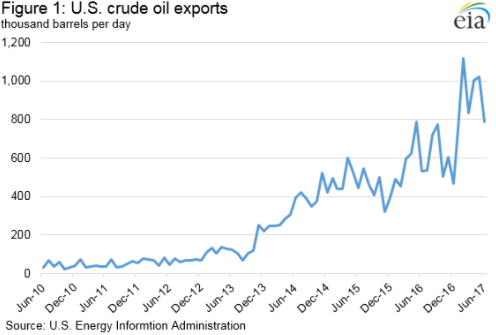
Crude oil exports in the first half of 2017 increased by more than 300,000 barrels per day (b/d) from the first half of 2016, a 57% increase. Petroleum product exports grew over the same period as well. Crude oil and propane exports each reached record highs of 0.9 million b/d, and distillate exports reached a record of 1.3 million b/d.
Although crude oil exports during the period grew, the growth rate in the first half of 2017 was lower than in the first halves 2013, 2014, and 2015 when exports increased at year-over-year rates of 88%, 134%, and 70%, respectively. Following the removal of restrictions on exporting U.S. crude oil in December of 2015, crude oil exports have been characterized by greater volatility. The range between the highest and lowest monthly exports in the first half of 2017 was 370,000 b/d, compared with 334,000 b/d in the first half of 2016. These levels are also greater than ranges in recent history of 161,000 b/d in 2015 and 147,000 b/d in 2014. Prior to 2014, crude oil exports tended to fluctuate less, with ranges commonly less than 100,000 b/d (Figure 1).
Distillate exports in the first half of 2017 outpaced those in the first half of 2016 by 14%, with exports to South and Central America accounting for nearly 70% (114,000 b/d) of this growth. As a result, the share of distillate exports to Central and South America increased slightly to 56%, while the share of exports to Western Europe fell to 19%. Mexico remained the largest single destination for U.S. distillate averaging 17% of total exports (223,000 b/d), followed by Brazil at 14% (180,000 b/d), and the Netherlands at 6% (81,000 b/d).
In the first half of 2017, despite consistently strong domestic demand, U.S. exports of total motor gasoline averaged a record high of 756,000 b/d, a 3% increase from the first half of 2016. High levels of domestic production of gasoline contributed to this record-high export level. Exports to Central and South America saw strong growth, increasing 24% over the first half of last year.
Mexico accounted for 53% of total U.S. gasoline exports. This level may have been driven partly by recent market reforms that allow entities other than state-owned Pemex to import petroleum products. Although Mexico produces large amounts of crude oil, refinery outputs such as gasoline have been declining since 2015. In the first half of 2017, Mexico suffered unexpected refinery outages that reduced production of gasoline and distillates even further, and U.S. exports of gasoline to Mexico increased by 27,000 b/d compared with the first half of 2016. U.S. gasoline exports to Canada fell from an average of 68,000 b/d in the first half of 2016 (the second highest after Mexico) to 22,000 b/d in the first half of 2017 (Figure 2).

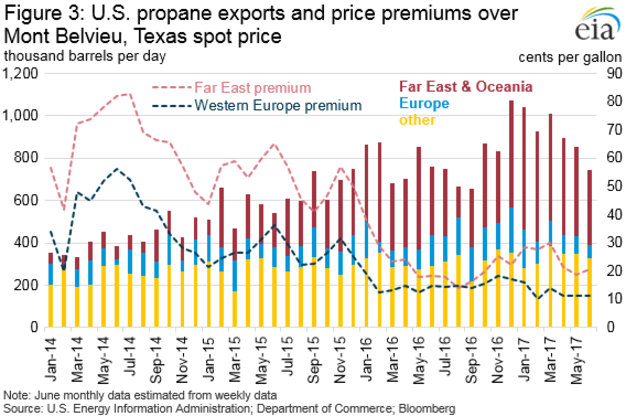
Total propane exports reached a record high of 913,000 b/d in the first half of 2017, up from 790,000 b/d in the first half of 2016. Most of the increase is from exports to Asian markets, which accounted for 74% of the growth.
Prior to the addition of significant propane export capacity in 2015 and 2016, total U.S. export volume was restricted by limited infrastructure. Now, with increased capacity, producers may take advantage of export opportunities. Low tanker rates and additional locks in the Panama Canal have put downward pressure on export costs, and Asian and European markets have maintained price premiums for propane compared with the U.S. market. In the first half of 2017, premiums in Asian markets averaged 24 cents per gallon and premiums in European markets averaged 12 cents per gallon (Figure 3).
Since 2014, total U.S. propane exports have grown with the expansion of export infrastructure. Higher volumes reaching international markets have helped to meet international propane demand, putting downward pressure on premiums in both Asian and European markets. With higher premiums than in other markets, Asia and Oceania’s share of total U.S. propane exports continued to rise, reaching 52% (473,000 b/d) in the first half of 2017, outpacing growth in all other regions (Figure 4).

U.S. average regular gasoline and diesel retail prices fall
The U.S. average regular gasoline retail price decreased 5 cents from the previous week to $2.58 per gallon on September 25, up 36 cents from the same time last year. The Midwest price fell eight cents to $2.37 per gallon, the East Coast price fell five cents to $2.64 per gallon, the Gulf Coast price fell over four cents to $2.42 per gallon, and the West Coast and Rocky Mountain prices each fell two cents to $3.00 per gallon and $2.58 per gallon, respectively.
The U.S. average diesel fuel price fell less than 1 cent, remaining at $2.79 per gallon on September 25, 41 cents higher than a year ago. The Gulf Coast price fell nearly two cents to $2.62 per gallon, the East Coast and Midwest prices each fell less than one cent, remaining at $2.81 per gallon and $2.74 per gallon, respectively, and the West Coast price remained unchanged at $3.10 per gallon. The Rocky Mountain price increased two cents to $2.83 per gallon.
Propane inventories fall
U.S. propane stocks decreased by 2.4 million barrels last week to 78.4 million barrels as of September 22, 2017, 24.9 million barrels (24.1%) lower than a year ago. Gulf Coast, East Coast, and Rocky Mountain/West Coast inventories decreased by 2.2 million barrels, 0.3 million barrels, and 0.1 million barrels, respectively, while Midwest inventories increased by 0.1 million barrels. Propylene non-fuel-use inventories represented 4.0% of total propane inventories.
This article is part of Crude
Tagged:
MARKET CONDITION REPORT - DISCLAIMER
The information contained herein is derived from sources believed to be reliable; however, this information is not guaranteed as to its accuracy or completeness. Furthermore, no responsibility is assumed for use of this material and no express or implied warranties or guarantees are made. This material and any view or comment expressed herein are provided for informational purposes only and should not be construed in any way as an inducement or recommendation to buy or sell products, commodity futures or options contracts.


