

Iran Conflict: Two Months of Record Prices, Volatility, and Global Fallout
Two months into the Iran conflict, oil markets have shifted from tight to severely disrupted. What began as early pressure in March escalated quickly as flows through the Strait of Hormuz deteriorated, forcing a rapid repricing of global supply risk.
That disruption has since moved well beyond crude, spreading through refined fuels, global trade flows, and key industrial inputs. Diesel, supply, and transportation costs have all come under pressure as supply losses mounted, and pricing volatility accelerated. What follows breaks down how quickly conditions escalated, where supply was most impacted, and how those shocks translated into rising costs and tightening markets across the global economy.
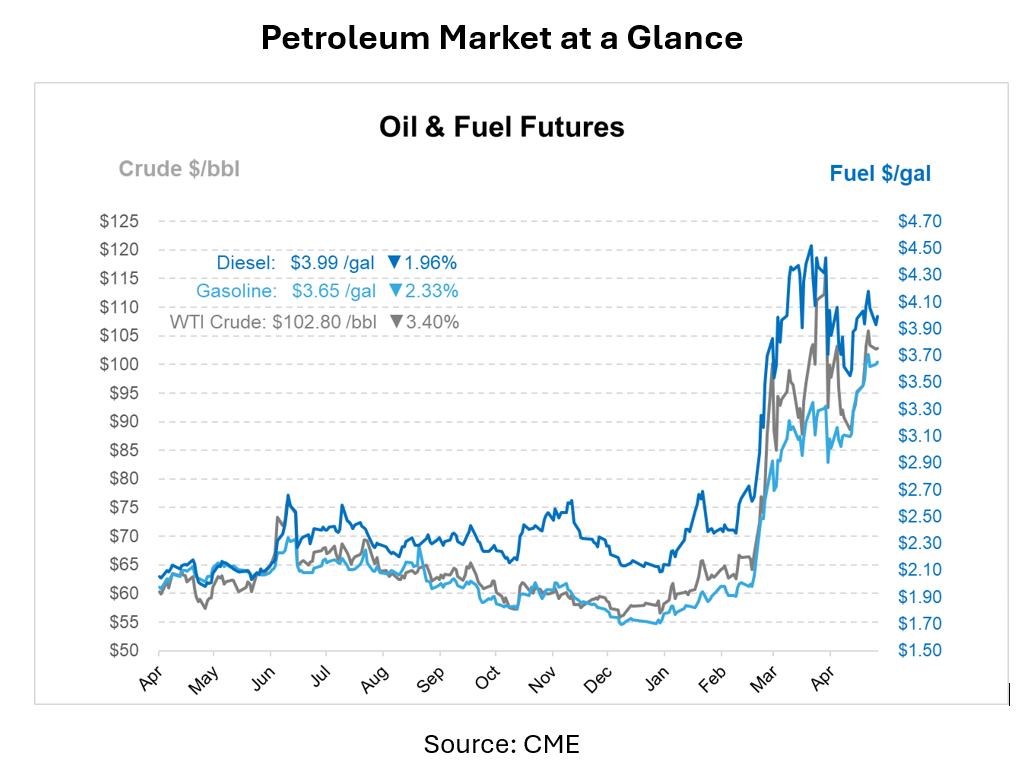
From March 1 to May 1, crude prices surged from the mid-$70s to wartime highs, with Brent peaking between above $120–$126/bbl and WTI climbing past $110/bbl by the end of April, marking a ~70%+ increase at peak levels. Volatility accelerated throughout April, with common swings of $3–$8/bbl becoming routine as markets reacted to real-time developments.
Refined products followed, with U.S. gasoline rising to about $4.20/gal by late April, reaching multi-year highs. Diesel remained elevated, averaging around $4.00–$4.30/gal nationally, while select regional markets such as the West Coast, briefly saw diesel prices approach $5.00–$5.50/gal amid tighter supply conditions.
The divergence between benchmarks became more pronounced as the crisis evolved. Brent reacted sharply to global supply risks, with major price jumps tied to specific events, such as the U.S. naval blockade announcement, the sharp drop in tanker traffic by mid-March, and continued vessel seizures and security incidents through late March and early April. Each escalation tightened waterborne supply expectations. WTI, while rising alongside Brent, was partially buffered early on by U.S. production, but began accelerating in mid-to-late April) as exports surged and domestic inventories drew down to support global shortages.
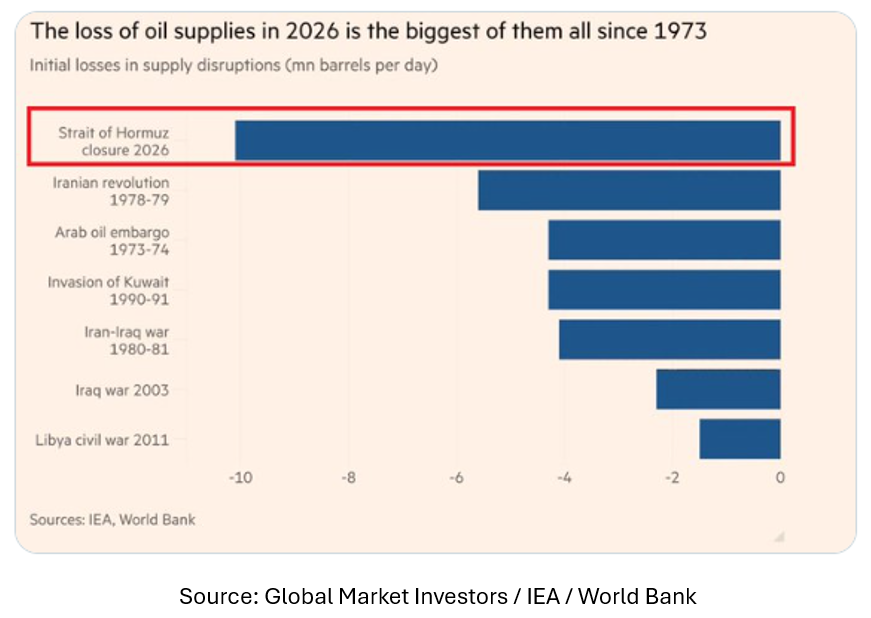
The impact looks even larger when viewed through Brent, the global benchmark most directly tied to waterborne supply. Prices rose from roughly $75/bbl in early March to about $125/bbl at peak levels in late April, reflecting the full weight of disrupted Middle East exports. When that increase is applied across global consumption, it translates to an estimated $300 billion in additional crude costs over the 60-day period. This reinforces how quickly supply shocks in seaborne markets scale across the global economy, especially when disruptions are concentrated in a region as critical as the Strait of Hormuz.
On the supply side, disruption intensified through the second half of March. By March 20–25, early signs of floating storage and delayed cargoes emerged. By early April, confirmed restrictions on transit pushed estimated supply losses into the 9–11 million bpd range, eventually peaking near 13–14 million bpd curtailed by mid-April (April 12–18). Over the full 60-day period (March–April), this equates to over 500 million barrels of disrupted supply, fundamentally tightening global balances and pushing prices higher.
The U.S. Department of Energy carried out Strategic Petroleum Reserve (SPR) releases through an exchange program in mid-to-late April (around April 17–24), adding incremental barrels to the system, though at a pace well below the scale of disruption. Meanwhile, OPEC+ signaled discussions on potential supply adjustments ahead of its early June meeting, but no immediate large-scale increases materialized during April. Sanctions targeting Iranian oil exports and related shipping networks remain in place and continue to constrain some export pathways. Policymakers have also monitored fuel market tightness closely as prices have risen, with occasional discussions around potential contingency measures in broader energy supply planning.
The disruption also spilled into fertilizer and diesel exhaust fluid (DEF) markets. Middle Eastern urea prices rose ~25% after the conflict escalated, tightening global nitrogen supply chains. By early-to-mid April, Argus data shows U.S. bulk DEF prices increased ~15–20¢/gal across major markets, while NOLA urea moved into the $700+ per ton range, underscoring the speed and magnitude of the cost shock.
The timeline of events highlights how quickly conditions escalated. The initial disruption in early March triggered the first leg higher. By mid-March, reduced tanker movement confirmed the severity of the situation. Late March into early April brought mounting evidence of supply bottlenecks and storage constraints within Iran, forcing production shut-ins. Through April, continued tensions, stalled negotiations, and discussions of potential military escalation sustained a strong risk premium in prices. Even brief moments of relief, such as isolated successful tanker transits in late April, proved temporary as broader access to the Strait remained constrained.
This article is part of Daily Market News & Insights
MARKET CONDITION REPORT - DISCLAIMER
The information contained herein is derived from sources believed to be reliable; however, this information is not guaranteed as to its accuracy or completeness. Furthermore, no responsibility is assumed for use of this material and no express or implied warranties or guarantees are made. This material and any view or comment expressed herein are provided for informational purposes only and should not be construed in any way as an inducement or recommendation to buy or sell products, commodity futures or options contracts.

 (1)")
")
