How NYMEX Prices Turn Into What You Pay at the Pump
When prices climb, it’s hard not to stand at the pump and wonder what’s really driving fuel costs, and why they can change so quickly. While it might be easy to point to “the economy,” fuel pricing is far more structured than that.
Every gallon reflects a chain of markets, decisions, and physical movement, from global crude oil trades to local terminal racks and delivery trucks. Understanding that chain explains how those movements take shape across regions, and why the price you see isn’t always the same as somewhere else. More importantly, it gives you clearer insight into your fuel spend and a better understanding of how market trends actually develop.
Step 1: NYMEX Sets the Market Signal
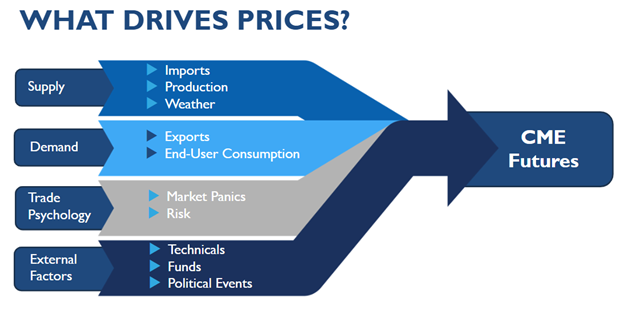
At the top of the pricing chain is the CME futures price (often called by its historic name, the NYMEX), where futures contracts for crude oil and refined products are traded. The NYMEX doesn’t set pump prices directly, but instead, it establishes a benchmark price for future delivery, reflecting market expectations for supply and demand.
These prices respond to:
- Global supply disruptions (geopolitics, OPEC decisions)
- Demand expectations (economic growth)
- Inventory levels
- Market sentiment and risk
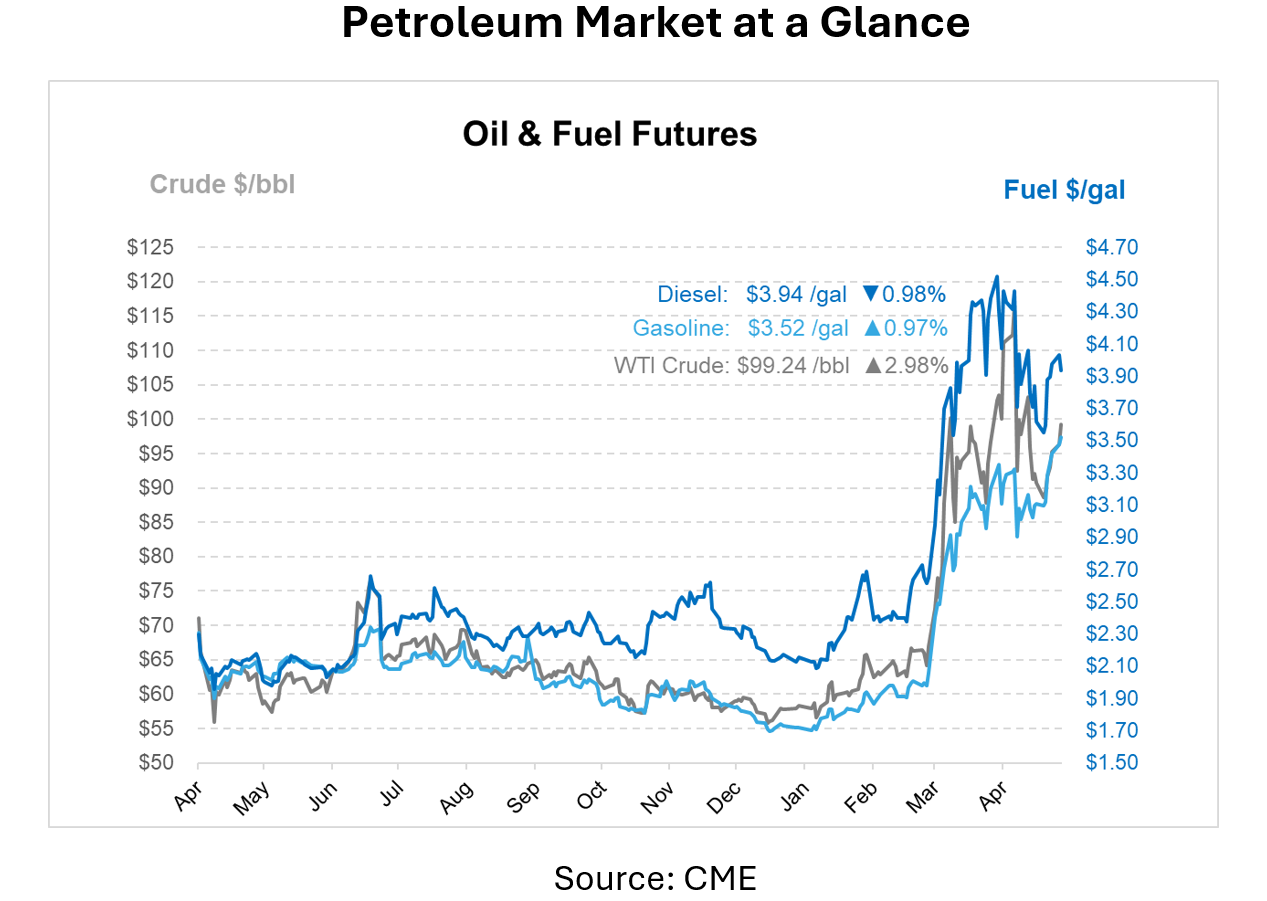
Because crude oil makes up roughly half of the price at the pump, movements in NYMEX futures often translate into retail price changes shortly after. This means that NYMEX is the starting point, but not the final price.
Step 2: From Futures to Wholesale (Rack Pricing)
After NYMEX sets the tone, pricing moves into the physical fuel market, where refined products like gasoline and diesel are bought and sold.
At this stage:
- Refineries purchase crude (influenced by NYMEX pricing)
- They process it into usable fuels
- Prices are then set at the rack (terminal level), often tied to:
- NYMEX refined product prices (RBOB, ULSD)
- Spot market benchmarks (like OPIS)
- Regional supply/demand conditions
- Transportation constraints
This is where basis differentials emerge, meaning the price in Texas may differ from the price in California, even if NYMEX is the same.
Step 3: Refining Adds Cost and Regional Complexity
Turning crude oil into gasoline is not a uniform process across the United States. Refining costs, fuel-formulation rules, seasonal blend requirements, and refinery outages all shape prices differently from one region to another. Refining typically accounts for about 16% of the final retail price of gasoline, but that share can vary depending on local conditions. Regions with stricter environmental requirements, such as reformulated fuels, or with more constrained refining capacity may face higher costs.
These differences help explain why fuel prices in places like California or the Northeast are often higher than those in the Gulf Coast.
Step 4: Distribution, Logistics, and Local Supply
After refining, fuel must move through pipelines or barges to terminals, incurring both transportation and throughput fees. Once at a terminal, comingled with product from other shippers, the fuel is dispensed from the loading rack to a fuel truck driver.
Distribution and marketing typically account for about 20% of the retail price and include pipeline transportation, terminal storage, truck delivery, and retail operations. Geography plays a big role in this part of the price.
Areas farther from refining hubs, or those with limited infrastructure or tighter local supply, often see higher fuel prices.
Step 5: Taxes and Regulations
Taxes are one of the most visible and variable components of fuel pricing. Federal taxes are 24.4 cents for diesel and 18.4 cents for gasoline. State and local taxes can differ by more than 60 cents per gallon depending on location, creating significant regional price gaps.
Step 6: Retail Pricing (What You See at the Pump)
By the time fuel reaches a gas station, the price reflects all prior stages.
Retailers:
- Purchase fuel at wholesale prices
- Add their margin
- Adjust pricing based on local competition and demand
Contrary to common belief, gas stations are typically price takers, not price setters, with limited control over overall pricing trends.
Bottom Line
Even with the same NYMEX benchmark, pump prices differ across the country. When fuel prices move, it’s rarely just “the economy” at work; instead, it’s a chain reaction that starts in global crude markets and flows through regional supply, logistics, and local demand. That’s why prices can look completely different from one market to the next, even on the same day.
Understanding how these markets connect helps fuel buyers anticipate changes instead of reacting to them. With the right market insight, volatility becomes something you can plan around, not be surprised by.
At Mansfield, we help bring clarity to fuel pricing by translating market complexity into actionable strategy, so you can make decisions with confidence. Reach out to a team member today!
Ready to make more informed decisions about your fuel purchasing strategy? Now You Can.
This article is part of Daily Market News & Insights
Tagged: crude oil futures, fuel distribution, Fuel Logistics, Fuel Price Volatility, fuel purchasing strategy, fuel supply chain, fuel taxes, NYMEX pricing, oil inventories, oil price benchmark, OPIS pricing, pipeline transportation, rack pricing, regional gas prices, spot market pricing, terminal storage, ULSD diesel, wholesale fuel pricing
MARKET CONDITION REPORT - DISCLAIMER
The information contained herein is derived from sources believed to be reliable; however, this information is not guaranteed as to its accuracy or completeness. Furthermore, no responsibility is assumed for use of this material and no express or implied warranties or guarantees are made. This material and any view or comment expressed herein are provided for informational purposes only and should not be construed in any way as an inducement or recommendation to buy or sell products, commodity futures or options contracts.

 (1)")
")
