What Is It Wednesday – 3:2:1 Crack Spread
Welcome to our continuing FUELSNews series: What Is It Wednesday. Each week, we’ll pick a fuel industry topic to explain, so you can learn more about the market and what drives it.
Imagine working for a company where you have no control over your raw material costs, and little control over your sales prices. That’s the daily reality for global oil refineries, which buy crude and convert it into diesel, gasoline, and other petroleum products. They have no control over their costs or sales prices, so how do they know what they’re earning? The 3:2:1 crack spread is the quick and easy way to calculate whether refiners are making a profit or not.
What Is the 3:2:1 Crack Spread?
First off, what is a crack spread? A crack spread is simply the difference between crude oil and refined products (diesel, gasoline, marine fuel, etc). There are two primary types of crack spreads: spreads between crude and one product (ex: crude vs diesel) and spreads between crude and multiple products (eg: crude vs diesel, gasoline, and jet fuel). The 3:2:1 crack spread is the latter, comparing crude oil to gasoline and diesel prices.
The 3:2:1 crack spread is a simple formula for estimating refinery profitability per barrel. For you math folks out there, the exact formula is:
[(Diesel * 42) + (Gasoline * 2 * 42) – (Crude * 3)]/3Let’s unpack that. First, the products. The formula assumes that 3 barrels of crude can be turned into 2 barrels of gasoline and 1 barrel of diesel, and nothing else. That’s simplistic, since that only considers 70% of the output from a barrel of fuel. But gas and diesel account for the bulk of a refinery’s profits, so it’s a good simplification for estimate purposes.
Next, why the 42? Crude oil is measured in barrels, and fuel is measured in gallons. There are 42 gallons in a barrel, so that portion simply converts everything to barrels. So really, it’s 1 barrel of diesel + 2 barrels of gasoline – 3 barrels of crude, divided by 3 to get down to just a single barrel.
Last, why “cracking”? The term is slang for the refining process, which takes crude oil and “cracks” it open with heat to separate it into different products.
Why Does the 3:2:1 Crack Spread Matter?
The 3:2:1 crack spread is a very helpful indicator of how tight the market is. Higher spreads mean the market does not have enough fuel, while low spreads indicate an abundance of supply. The direction of the spread is also important – if prices are rising, then fuel inventories are likely getting worse. On the other hand, high prices typically bring increased refining activity, so high crack spreads today may bring lower fuel prices and better supply optionality in the future.
Spreads are particularly interesting for those trading petroleum futures or hedging their costs. Refiners can use market instruments to lock in a set crack spread, reducing their risk. Depending on how a commercial fuel buyer hedges their fuel, they may also want to keep track of forward crack spreads.
What Impacts 3:2:1 Spreads?
The 3:2:1 crack spread is as volatile as the entire petroleum industry, where prices move every second and can be influenced by geopolitics, political statements, or a simple Tweet. However, spreads tend to be more stable and predictable over time compared to commodity prices, since oil products rise and fall at the same time.
Spreads are most impacted by supply and demand. When the market has too much crude oil and not enough fuel, crude oil prices fall and fuel prices rise. The result is higher spreads. Too much fuel and not enough crude can have the opposite effect. Product inventories and days of supply are important metrics in determining how spreads will change.
Refinery utilization is another important consideration. As crack spreads rise, refineries are incentivized to produce more products to capture more margin. That leads to less crude oil as refiners chew through inventories, as well as more fuel. Like many other market categories, the best cure for high crack spreads is high crack spreads.
Historical Price Levels
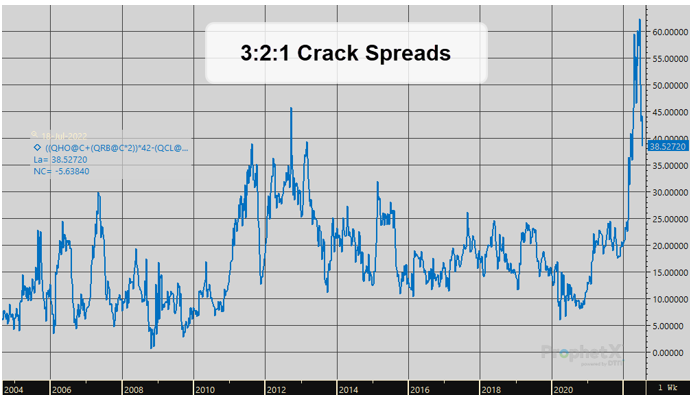
What’s a normal level for crack spreads? From 2014-2020, crack spreads kept to a fairly stable range between $10/bbl and $25/bbl. Deviations from this range usually brought a quick reversal, giving refiners some predictability over their margins. However, various periods have seen bigger swings.
Before 2008, crack spreads tended to be lower, keeping to the $5-$20/bbl range. After the Great Recession, margins sprung higher for a few years, averaging $20-$30. Recently, crack spreads have exploded to record highs due to the Russia-Ukraine conflict, inflation, and low global refining capacity.
Other Crack Spreads
There are many different crack spreads tracked by the industry. For instance, the 4:3:2:1 spread measures the value of converting 4 barrels of crude into 3 barrels of gasoline, 2 barrels of diesel, and 1 barrel of jet fuel. There’s also a 5-3-2 crack spread and a 2-1-1 crack spread, each of which considers crude, gasoline, and diesel, respectively.
Crack spreads can also measure different geographies. For instance, a refinery in Pennsylvania probably isn’t using Texas’ WTI crude, so they may substitute Europe’s Brent crude oil as their crude oil price. Alternatively, a refinery in Texas may choose to use WTI crude but a Gulf Coast fuel price, rather than the CME’s ULSD and RBOB contract based in NY Harbor.
Want to make your own crack spread? The EIA calculates refinery yields by product, so you can see exactly how many gallons of refined products come from one barrel of crude oil. Maybe you care more about asphalt and lubricants, or perhaps your focus is exclusively on diesel and nothing else. With a good understanding of industry economics, you can better understand market dynamics and predict trends that are important for your business.
This article is part of Daily Market News & Insights
MARKET CONDITION REPORT - DISCLAIMER
The information contained herein is derived from sources believed to be reliable; however, this information is not guaranteed as to its accuracy or completeness. Furthermore, no responsibility is assumed for use of this material and no express or implied warranties or guarantees are made. This material and any view or comment expressed herein are provided for informational purposes only and should not be construed in any way as an inducement or recommendation to buy or sell products, commodity futures or options contracts.
