EIA Weekly Data Reveals Key Trends
The EIA’s oil report yesterday revealed some interesting trends that are relevant to both fuel suppliers and consumers. Crude inventories fell, which would normally boost oil prices, yet prices dropped below $50 yesterday. Gasoline stocks rose while diesel stocks fell, yet both products saw higher prices during yesterday’s trading sessions. While markets typically focus on inventory levels and skim the rest of the data, this week markets honed in on a few other important trends, leading to some surprise price movements.
Exports Rise to All-Time High
In last week’s EIA report, markets were excited to see that U.S. crude output hit an all-time high – rising to nearly 1,500 thousand barrels per day (kbpd). This week, exports blew the old record out of the water with a whopping 1,984 kbpd export record. The key driver of those exports has been the growing spread between Brent and WTI prices, which recently has gotten as high as $6/bbl.
Any time the spread rises above roughly $4/bbl, producers have strong incentive to export WTI barrels in substitution of Brent oil, leading to higher exports. The below chart shows Harvey’s effect – exports dropped during the storm, then soared higher in recent weeks, while spreads have remained high.
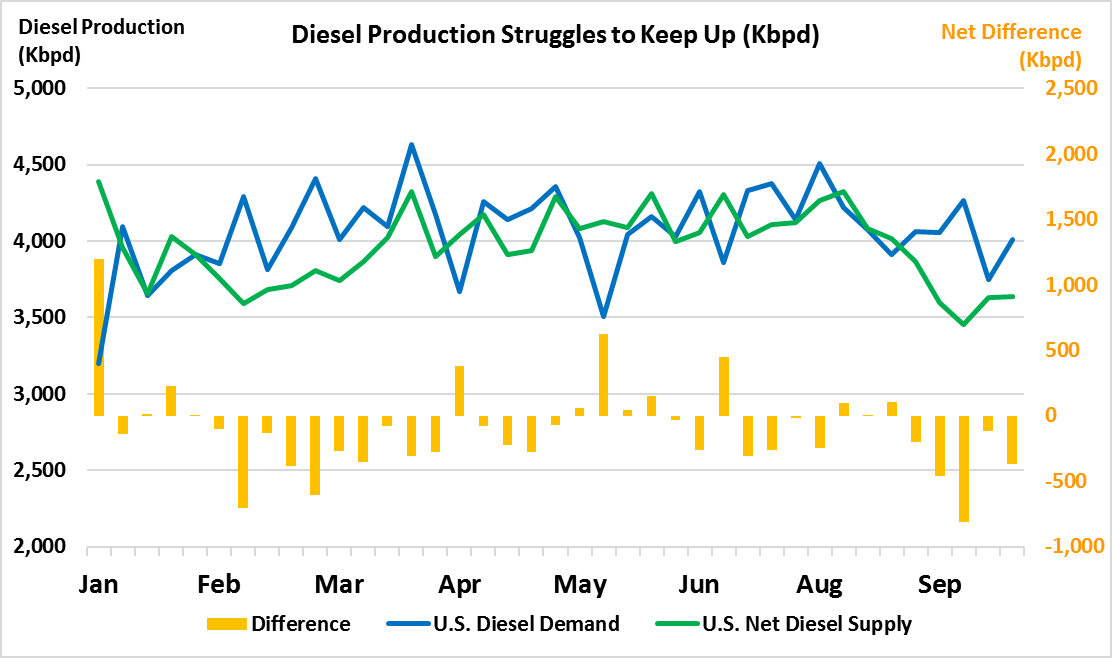
Diesel Supply Struggles to Keep up
Diesel supplies in the U.S. have struggled to keep up with demand, leading to stock draws and price strength. Looking at the chart below, the green line, which represents U.S. diesel production and imports, less diesel exports, has fallen significantly since August, while demand (blue line) has remained in line with average.The gap has led to some steep stock draws in recent weeks, helping boost diesel prices to two-year highs.
At issue here is production, which has fallen from averaging over 5 Mbpd to below 4 Mbpd during the hurricane. Production has yet to realize its previous high levels. During Harvey, a significant portion of refining capacity was knocked offline; U.S. production remains hurt by those outages.
Days of Supply are Falling for Refined Products, Up for Crude
Throughout the year, days of supply – the amount of supplies available if all production ceased – has been trending downward for all oil products. Days of supply is a better indicator of available stocks than raw inventory data; as demand grows in the U.S., we’ll naturally need more supplies in reserve to remain safe. The actual amount of supplies available varies widely, but over the long-term diesel typically averages 35 days of supply, gasoline averages 24 days, and crude oil averages 21 days.
Diesel began the year far above its historical average, but has since returned to normal, dropping this week to its lowest level of the year – 33.7 days of supply. Gasoline is just off its annual bottom of 22.7 days of supply, which occurred at the peak of Hurricane Harvey.
Interestingly, crude supply has risen significantly, and this may be the main reason why crude prices remain low. Crude days of supply was heading lower leading up to Hurricane Harvey, but since then has been elevated to levels not seen since May. With more inventories in the U.S. than we need, we’ve been exporting crude to other countries to capitalize on Brent-WTI spreads, while still having plenty of crude left for ourselves. This chart clearly shows why refined products have seen such strength the last few weeks, while crude prices have languished.
This article is part of Uncategorized
Tagged: Days of Supply, eia, Exports, imports
MARKET CONDITION REPORT - DISCLAIMER
The information contained herein is derived from sources believed to be reliable; however, this information is not guaranteed as to its accuracy or completeness. Furthermore, no responsibility is assumed for use of this material and no express or implied warranties or guarantees are made. This material and any view or comment expressed herein are provided for informational purposes only and should not be construed in any way as an inducement or recommendation to buy or sell products, commodity futures or options contracts.


