EIA expects natural gas to be largest source of U.S. electricity generation this summer
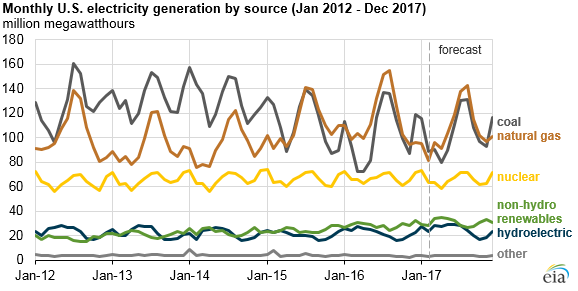
EIA’s April 2017 Short-Term Energy Outlook (STEO) expects that electricity generation fueled by natural gas this summer (June, July, and August) will be lower than last summer, but it will continue to exceed that of any other fuel, including coal-fired generation, for the third summer in a row. The projected share of total U.S. generation for natural gas is expected to average 34%, which is down from 37% last summer but still exceeds coal’s generation share of 32%.
Based on data from the National Oceanic and Atmospheric Administration (NOAA), EIA estimates that average U.S. population-weighted cooling degree days in the summer of 2016 reached the highest level on record. NOAA projections for this summer indicate cooling degree days will be 11% lower than last year. These milder expected temperatures lead to forecast U.S. summer electricity generation of 1.16 billion megawatthours, which would be 2.4% lower than generation last summer.
Generation fueled by natural gas typically peaks in the summer when power plant operators use natural gas-fired combustion turbines during the hottest part of the day to meet electricity demand for air conditioning. Natural gas first exceeded coal as the nation’s primary electricity fuel on a monthly basis in April 2015 and on an annual basis in 2016. During the summer of 2016, at a time when natural gas prices were relatively low, 37% of U.S. electricity generation came from natural gas and 33% came from coal. A decade before that, in summer 2006, 25% came from natural gas and 46% from coal.
The use of natural gas in the power sector is sensitive to natural gas prices. As natural gas prices have risen, the natural gas share of the electricity generation mix has fallen slightly. Over the first three months of 2017, the Henry Hub natural gas price averaged $3.01 per million Btu (MMBtu) compared with $2.00/MMBtu during the same period of 2016. As a result, the natural gas share of the U.S. electricity mix fell from 32% in the first quarter of 2016 to 29% in the first quarter of this year, while coal’s share of generation rose from 29% to 31% over that same period. EIA expects that the Henry Hub price will continue to average slightly more than $3.00/MMBtu through the summer.
At the national level, shares of both natural gas and coal are expected to be lower than last summer, as output from hydroelectric and other renewable generators is expected to increase. The Midwest region is the only area of the country in which coal fuels more than half of summer electricity generation (54%). In other regions, no single fuel provides the majority of electricity generation during the summer. The Northeast and South regions are close to this level, with natural gas accounting for an expected 44% and 43% of total summer generation, respectively.
Western states have a more diverse mix of energy sources for electricity generation, including access to some of the largest sources of hydropower in the United States. After enduring an exceptional drought, California experienced record levels of precipitation and snowpack this past winter, and hydroelectricity’s share of generation in the West is expected to rise from 20% last summer to 27% this summer. This increase, along with increased solar capacity because of new solar additions, should reduce the need for natural gas-fired generation in the West, where the forecast generation share falls from 34% to 27%.

Note: Percentages indicate share of total regional generation fueled by natural gas. Summer period defined as the months of June, July, and August.
This article is part of Daily Natural Gas Newsletter
Tagged: coal, eia, EIA Short-term energy outlook report, natural gas, STEO
MARKET CONDITION REPORT - DISCLAIMER
The information contained herein is derived from sources believed to be reliable; however, this information is not guaranteed as to its accuracy or completeness. Furthermore, no responsibility is assumed for use of this material and no express or implied warranties or guarantees are made. This material and any view or comment expressed herein are provided for informational purposes only and should not be construed in any way as an inducement or recommendation to buy or sell products, commodity futures or options contracts.


