U.S. crude oil exports went to more destinations in 2016
In 2016, U.S. crude oil exports averaged 520,000 barrels per day (b/d), 55,000 b/d (12%) more than in 2015 despite a year-over-year decline in production. However, the rate of U.S. crude oil export growth has slowed significantly from its pace over 2013-15 when annual U.S. crude production grew rapidly. Meanwhile, increased crude oil imports in 2016 have substituted for some domestic crude oil at U.S. refineries, allowing for increased refinery runs despite lower production and higher exports.
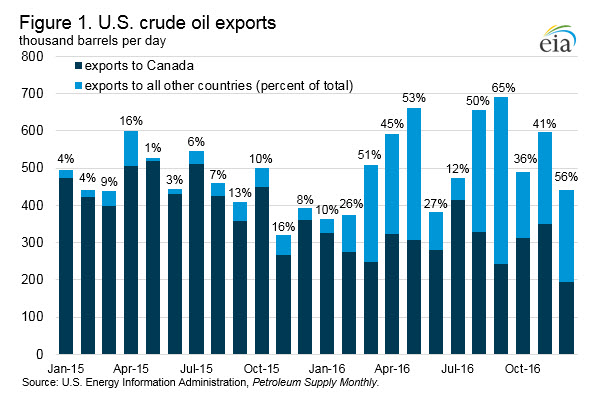
Following the removal of restrictions on U.S. crude oil exports in December 2015, the United States exported crude oil to 26 different countries in 2016, compared with 10 the previous year. In 2015, 92% of U.S. crude oil exports went to Canada, which was exempt from U.S. crude oil export restrictions. After the lifting of restrictions, Canada remained the top destination, but on average in 2016 received only 61% of U.S. crude exports (Figure 1).
Aside from Canada, European destinations such as the Netherlands, Italy, the United Kingdom, and France rank high on the list of U.S crude oil export destinations. The next largest regional destination is Asia, including China, Korea, Singapore, and Japan. In 2016, the United States exported to eight different Central and South American destinations including Curacao, Colombia, and Peru (Figure 2).
Some nations listed as receiving crude oil exports from the United States in EIA export statistics, such as the Marshall Islands, Bahamas, Panama, and Liberia, are unlikely to be actual final destinations. Ports in the United States are not deep or wide enough to allow safe navigation and loading of the largest and most economic ships to transport crude oil, such as Very Large Crude Carriers (VLCC). Instead, U.S. crude oil is exported on smaller vessels and is then transferred to larger vessels in deeper waters outside of port. The U.S. Customs and Border Protection documentation requires the final destination of an export to be listed, if known. In some cases, cargoes that undergo ship-to-ship transfer or that do not have a buyer prior to loading will cite the jurisdiction of the transfer or the registration flag of the vessel to which the cargo is being transferred, not the cargo’s actual final destination. Many vessels are registered in nations such as the Marshall Islands, Bahamas, Liberia, and Panama—meaning the exported crude oil was likely destined elsewhere.
Curacao, located in the Caribbean Sea north of Venezuela, received 30,000 b/d of U.S. crude oil in 2016, making it the third largest destination. Petróleos de Venezuela (PDVSA), the state-owned oil company of Venezuela, operates the 330,000 b/d Isla refinery on Curacao, as well as crude and petroleum product storage facilities on the island. Trade press reports and tracking of ship movements indicate that U.S. crude exports to Curacao are likely being blended with heavy Venezuelan crude oil, for either processing at the Isla refinery or re-export to PDVSA customers.
The 2016 increase in U.S. crude oil exports occurred despite relatively narrow price spreads between domestic and international crude oils. In 2016, the spot price premium of Brent crude oil over West Texas Intermediate (WTI) crude oil averaged $0.41 per barrel (b), typically insufficient to cover the costs associated with exporting and transporting crude oil. Another factor limiting U.S. crude oil exports was decreased U.S. production. Average crude oil production for 2016 was 8.9 million b/d, 500,000 b/d less than in 2015.
However, several factors culminated in 2016 to facilitate increased U.S. crude oil exports. Low tanker rates for most of 2016 meant that the price spread needed for an economically attractive trade between the United States and another market was narrower. Additionally, the United States imported 7.9 million b/d of crude oil in 2016, meaning many ships were likely available for back-haul voyages, which is the trip a tanker would normally make empty while returning to a port to load its next cargo. Rates for back-haul voyages are significantly discounted versus regular tanker rates and could even further narrow the price spread needed for an economically attractive trade.
Recently, as U.S. refineries underwent planned turnarounds, which reduced crude runs, and as the spot price spread between Brent and WTI increased to $2.08/b in January, U.S. crude oil exports exceeded 1 million b/d for the weeks ending February 10 and 17.
This article is part of Daily Market News & Insights
MARKET CONDITION REPORT - DISCLAIMER
The information contained herein is derived from sources believed to be reliable; however, this information is not guaranteed as to its accuracy or completeness. Furthermore, no responsibility is assumed for use of this material and no express or implied warranties or guarantees are made. This material and any view or comment expressed herein are provided for informational purposes only and should not be construed in any way as an inducement or recommendation to buy or sell products, commodity futures or options contracts.


