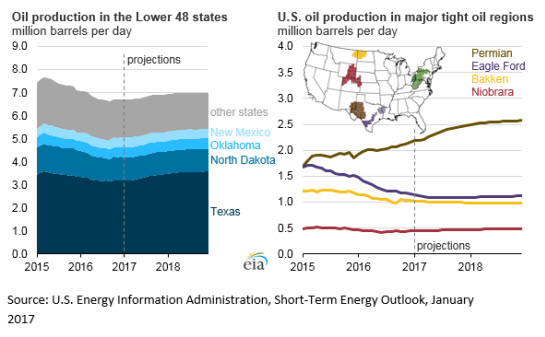
Major U.S. tight oil-producing states expected to drive production gains through 2018
In EIA’s January Short-Term Energy Outlook, U.S. crude oil production is forecast to increase from an average of 8.9 million barrels per day (b/d) in 2016 to an average of 9.3 million b/d in 2018, primarily as a result of gains in the major U.S. tight oil-producing states: Texas, North Dakota, Oklahoma, and New Mexico. Of these states, Texas and North Dakota will continue to be the largest producers of crude oil because of the large amounts of economically recoverable resources in the Eagle Ford, Permian, and Bakken regions.
Production in Texas, the largest oil-producing state, is driven by two major oil-producing regions, the Permian and the Eagle Ford. As defined in EIA’s Drilling Productivity Report, the Permian region makes up a large geographic area with producing zones each more than 1,000 feet thick and with multiple stacked plays. Because of its large geographic size, the Permian offers a lot of potential for testing and drilling, and the multiple stacked plays allow producers to continue to drill both vertical wells and hydraulically fractured horizontal wells.
Although overall U.S. oil production has been declining since mid-2015, production has continued to increase in the Permian region. In 2016, Permian production averaged 2.0 million b/d, a 5% increase from the level in 2015. EIA expects this trend to continue, with Permian production projected to average 2.3 million b/d in 2017 and 2.5 million b/d in 2018.
Compared with the Permian region, the Eagle Ford region has fewer overall drilling opportunities in core areas. The Eagle Ford region has a significantly smaller geographic area than the Permian region, and the region’s target producing zones are only about 200–300 feet thick, compared to the thousands of feet within the Permian. As with most shale and tight oil regions, the Eagle Ford region has wells with high initial production rates, but faster than average production rate declines. Because of these production rates, drilling fewer new wells has a more immediate effect on production. As low oil prices slowed the pace of drilling, production in the Eagle Ford region has declined since March 2015, with average annual production at 1.6 million b/d in 2015 and 1.3 million b/d in 2016.
Although declines in Eagle Ford production are expected to continue through the first half of 2017, EIA expects production in that region will begin increasing in the third quarter of 2017 and will continue to increase through 2018 as higher oil prices encourage more drilling activity. With the combination of the Permian’s continued growth and renewed production in the Eagle Ford, Texas is expected to continue to be the largest-producing state through 2018.
The Bakken and Three Forks formations drive crude oil production in North Dakota, which has been in decline since 2015 in response to lower prices. Unlike in Texas, producers in North Dakota have additional infrastructure constraints involved in transporting their products to market. During the winter, production costs increase as operators must deal with below-freezing temperatures and heavy snowfall. However, as in the Eagle Ford, new drilling is expected to increase, enabling overall Bakken production to stay at least flat through 2018.
More information about current drilling activity and production in key regions is available in EIA’s Drilling Productivity Report. More information about monthly production and price expectations through 2018 is available in EIA’s Short-Term Energy Outlook.
This article is part of Daily Market News & Insights
Tagged: 2018, oil, production, U.S.
MARKET CONDITION REPORT - DISCLAIMER
The information contained herein is derived from sources believed to be reliable; however, this information is not guaranteed as to its accuracy or completeness. Furthermore, no responsibility is assumed for use of this material and no express or implied warranties or guarantees are made. This material and any view or comment expressed herein are provided for informational purposes only and should not be construed in any way as an inducement or recommendation to buy or sell products, commodity futures or options contracts.


