Crude Draw Spurs Higher Crude Prices, but Crack Spreads Fall
Oil prices were mixed early this morning, following last night’s API inventory data. The organization showed crude inventories falling by over 8 million barrels – more than double the expected draw. On the flip side, fuel inventories rose by more than expected. This morning, the EIA’s data confirmed yesterday’s outlook, with a steep crude draw and rising gasoline stocks. Diesel inventories posted a surprise draw, keeping markets on their toes. Since the 10:30 release of the EIA data, markets have been moving consistently higher.
Expectation API EIA
Crude -3.0 MMbbls -8.5 MMbbls -7.4 MMbbls
Diesel +0.5 MMbbls +2.0 MMbbls -1.0 MMbbls
Gasoline -0.7 MMbbls +2.9 MMbbls +2.0 MMbbls
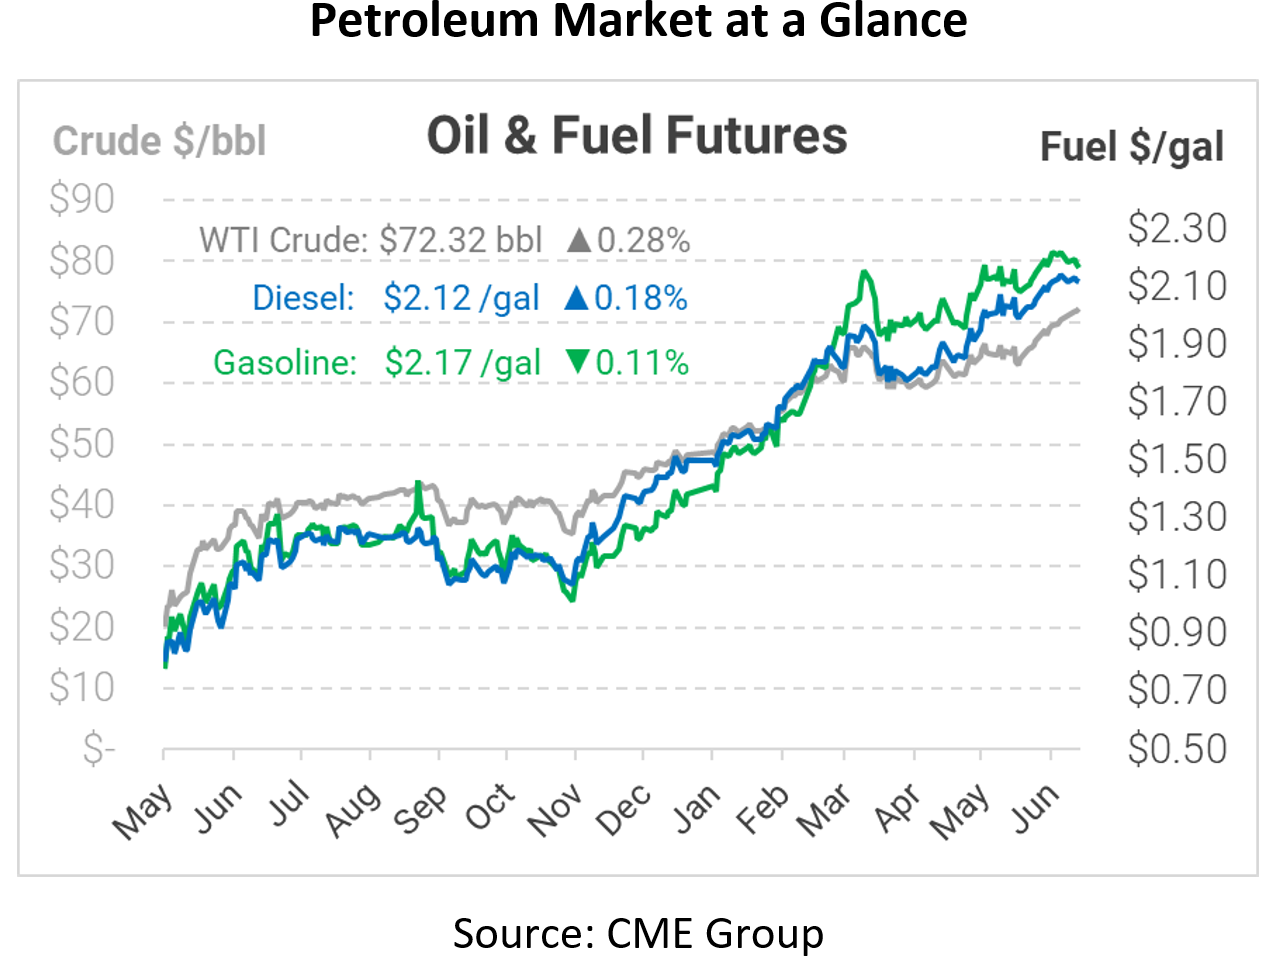
With inventories still adjusting to post-COVID trends, crude oil markets are continuing to trade near multi-year highs, while fuel prices have fallen back somewhat. The disjoint between rising crude prices and settling fuel prices is not too surprising. Refineries are finally getting back to normal throughput levels, meaning they’re consuming more crude and supplying more fuel. That dynamic helps to balance inventories and moderate fuel prices.
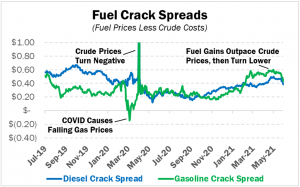
Crack spreads, a simple price differential between a gallon of diesel/gasoline and a gallon of crude oil, have been rising for both gasoline and diesel since late 2020. Gasoline crack spreads rose to 60 cents early in 2021 – meaning refiners were earning roughly 60 cents on every gallon of gasoline they produced. Before COVID, gasoline crack spreads were around 20-30 cents. Diesel crack spreads, which were high before COVID, have been more moderate this year, hovering around 40 cents per gallon.
Over the past week, gasoline crack spreads have fallen nearly 20 cents – an unusual trend during the summer.
This article is part of Daily Market News & Insights
Tagged: API, Crack Spreads, crude, eia
MARKET CONDITION REPORT - DISCLAIMER
The information contained herein is derived from sources believed to be reliable; however, this information is not guaranteed as to its accuracy or completeness. Furthermore, no responsibility is assumed for use of this material and no express or implied warranties or guarantees are made. This material and any view or comment expressed herein are provided for informational purposes only and should not be construed in any way as an inducement or recommendation to buy or sell products, commodity futures or options contracts.


