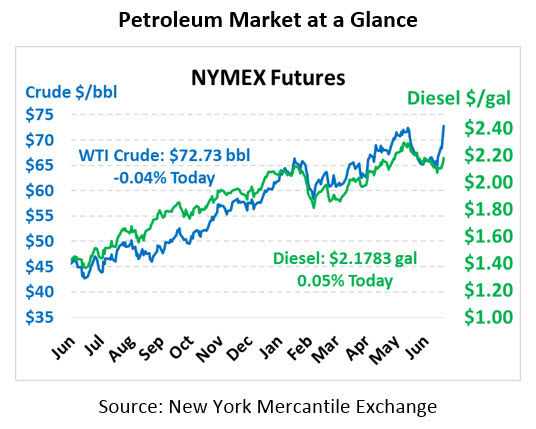
Crude Hits 2.5 Year High
When it comes to market volatility, it’s quite telling that last week’s Thursday headline was “Gasoline Briefly Dips Below $2/gal,” in contrast to this morning’s news. Crude picked up over $2/bbl yesterday, following $1.50 gains the day before, and ended the session at a record $72.76. This morning, prices have cooled somewhat, with crude trading at $72.73, down 3 cents.
Fuel prices got a boost from crude’s gains, despite both products posting modest inventory gains. Diesel prices added nearly 5 cents yesterday, and gasoline gains were nearly 6 cents. This morning, diesel is trading marginally higher at $2.1783, a tiny gain of 0.1 cents. Gasoline is trading lower at $2.1287, losing half a cent since yesterday’s close.
Crude Draw Causes 2.5-Yr Price High
The EIA released its weekly petroleum market data yesterday, which included the largest crude inventory draw (9.9 million barrels) since September 2016. Crude stocks are drawing down rapidly, a normal trend for this time of year as refineries burn through the crude oil stocked up over the winter. With markets concerned about Venezuelan and Iranian supply cuts, the steep inventory draw seems quite severe. In reality, the draw was more directly linked to exports rising to a record 3 million barrels per day in response to steep Brent-WTI spreads last week.
While crude’s huge draw was the major takeaway from the report, there were some other notable statistics. Refinery utilization increased again this week, extending the 7-week streak of gains from 90.4% to this week’s 97.5% utilization. That’s the highest refinery utilization statistic since June 2001. With refineries pumping out fuel near maximum capacity, fuel inventories have managed to show moderate builds over the summer despite strong fuel demand.
This article is part of Crude
Tagged:
MARKET CONDITION REPORT - DISCLAIMER
The information contained herein is derived from sources believed to be reliable; however, this information is not guaranteed as to its accuracy or completeness. Furthermore, no responsibility is assumed for use of this material and no express or implied warranties or guarantees are made. This material and any view or comment expressed herein are provided for informational purposes only and should not be construed in any way as an inducement or recommendation to buy or sell products, commodity futures or options contracts.


