

EIO Short-Term Energy Outlook – Petroleum Products
Gasoline prices: The front-month futures price of reformulated blendstock for oxygenate blending (RBOB, the petroleum component of gasoline used in many parts of the country) rose by 21 cents per gallon (gal) from October 2 to settle at $1.77/gal on November 2 (Figure 5). The RBOB-Brent crack spread (the difference between the price of RBOB and the price of Brent crude oil) rose by 11 cents/gal to settle at 33 cents/gal over the same period. EIA compares RBOB prices to Brent prices because EIA research indicates that U.S. gasoline prices usually move with Brent prices, the international crude oil benchmark.
The average gasoline crack spread in October was 12 cents/gal higher than the five-year average for October, as gasoline inventories declined and as U.S. gasoline consumption increased. In this STEO, EIA estimates U.S. gasoline consumption in October averaged 9.3 million b/d, which would be a record high for the month of October. Also in this STEO, EIA estimates that gasoline stocks at the end of October were 7.2 million barrels (3%) lower than the end-of-September levels and 13.2 million barrels (6%) lower than the level at the end of October 2016.
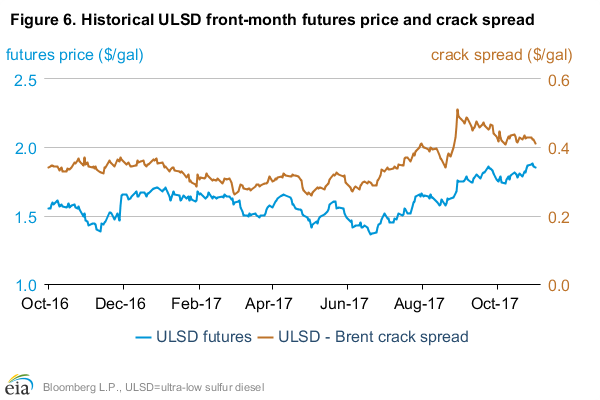
Ultra-low sulfur diesel prices: The ultra-low sulfur diesel (ULSD) futures price increased by 9 cents/gal from October 2 to settle at $1.85/gal on November 2. The ULSD-Brent crack spread (the difference between the price of ULSD and the price of Brent crude oil) declined 2 cents/gal over the same period, settling at 41 cents/gal (Figure 6).
The ULSD crack spread has remained higher than last year’s level each month since July 2017, as distillate consumption and exports increased and U.S. distillate inventories declined. For much of 2017, year-over-year levels of U.S. distillate consumption and exports have been higher. During the first three quarters of 2017, EIA estimates U.S. distillate consumption was almost 70,000 b/d (2%) higher than during the same period in 2016. Distillate fuel exports set new five-year highs in all but one month so far in 2017, according to the Petroleum Supply Monthly (PSM). Higher consumption and exports have contributed to the decline in U.S. distillate stocks. EIA estimates that U.S. distillate inventories at the end of both September and October were below the five-year average for those respective months. These two months were the first since March 2015 that distillate inventories were below the five-year average at the end of any month.
U.S. distillate exports have risen significantly in 2017. In July 2017, U.S. distillate exports rose to a record 1.7 million b/d before declining to 1.4 million b/d in August. Looking at U.S. distillate exports as a percentage of U.S. distillate production illustrates the growing importance of U.S. exports in the global distillate market. U.S. distillate exports as a share of U.S. distillate production rose to a record high of 33% in July but then declined to 27% in August (Figure 7).
Compared with the first eight months of 2016, distillate exports this year were 16% higher, with increased exports to most major regions. The largest increases in U.S. distillate exports were to Central and South America, as oil distributors in Brazil began purchasing more competitively priced fuel from overseas sources rather than from its state-owned oil company, Petrobras. Beyond regional factors, broad-based economic growth among developed and emerging markets is a major contributor to increased distillate consumption globally.
This article is part of Crude
Tagged:
MARKET CONDITION REPORT - DISCLAIMER
The information contained herein is derived from sources believed to be reliable; however, this information is not guaranteed as to its accuracy or completeness. Furthermore, no responsibility is assumed for use of this material and no express or implied warranties or guarantees are made. This material and any view or comment expressed herein are provided for informational purposes only and should not be construed in any way as an inducement or recommendation to buy or sell products, commodity futures or options contracts.

 (1)")
")
