U.S. exports of crude oil and petroleum products rising, but trends vary across products
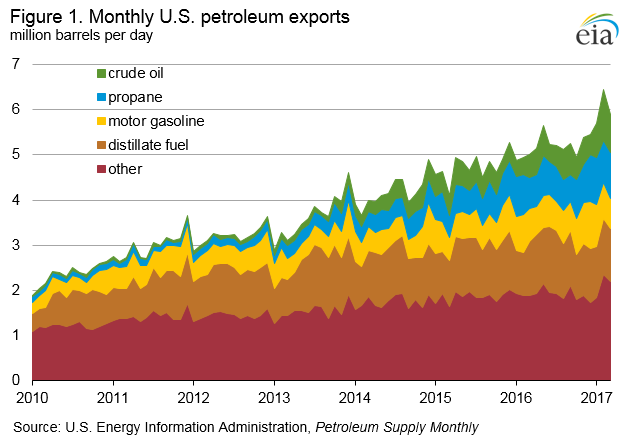
U.S. total crude oil and petroleum product exports more than doubled from 2.4 million barrels per day (b/d) in 2010 to 5.2 million b/d in 2016. While exports of distillate, gasoline, propane, and crude oil have all contributed to the increase, growth rates and market drivers for each product have varied during this period (Figure 1).
Crude Oil
Restrictions on exporting domestically-produced crude oil were lifted in December 2015, and in 2016, the United States exported 520,000 b/d. U.S. crude oil exports reached 1.1 million b/d, the highest monthly level recorded to date, in February 2017. While Canada remains the largest destination for U.S. crude oil exports, its share of total U.S. crude oil exports has declined, dropping from 92% in 2015 (427,000 b/d) to 58% in 2016 (301,000 b/d). Other leading destinations for U.S. crude oil exports in 2016 included the Netherlands, Curacao, China, Italy, and the United Kingdom. In addition to export restrictions, the level of U.S. crude exports are sensitive to price differentials, shipping costs, and the level of domestic production. U.S. production fell through the first nine months of 2016, but rose at the end of 2016 and the first five months of 2017. In 2016, U.S. crude oil exports increased 55,000 b/d over 2015, but year-over-year growth in both 2014 (217,000 b/d) and 2015 (114,000 b/d) were considerably higher (Figure 2).
Distillate
U.S. exports of distillate also experienced slower year-over-year growth rates compared with recent years. In 2016, the United States exported 1.2 million b/d of distillate, the country’s largest petroleum product export. Between 2010 and 2016, U.S. exports of distillate grew by 81% (534,000 b/d), but most of this growth occurred between 2011 and 2013. The largest destination for U.S. distillate exports is Mexico, averaging 182,000 b/d in 2016, followed by Brazil (125,000 b/d), and the Netherlands (108,000 b/d).
Gasoline
U.S. exports of total motor gasoline have increased by 126% (425,000 b/d) since 2010. The growth in gasoline exports took place while domestic consumption, as measured by product supplied, was also increasing. Mexico is the top destination for U.S. total motor gasoline exports and the volume of gasoline trade is significant to U.S. refineries. Over the past five years, U.S. exports to Mexico accounted for between 44% (2014) and 53% (2016) of total U.S. gasoline exports.
Propane
Unlike the recently slowing increases in U.S. exports of crude oil, distillate fuel, and motor gasoline, propane export growth has recently accelerated. Propane exports differ from other U.S. petroleum exports with respect to where they are shipped. Whereas most other U.S. petroleum exports stay in the Western Hemisphere, Japan and China are the top destinations for U.S. propane exports. Propane has many non-transportation sector end uses, including space heating, cooking, and as a petrochemical feedstock.
Additional information
The possibilities of this pace of growth continuing, the challenges each exported product face in the near future, and other questions, will be discussed at the upcoming EIA Energy Conference panel — Petroleum exports: Competing in the global market.
This article is part of Crude
Tagged: eia, oil exports, us oil production
MARKET CONDITION REPORT - DISCLAIMER
The information contained herein is derived from sources believed to be reliable; however, this information is not guaranteed as to its accuracy or completeness. Furthermore, no responsibility is assumed for use of this material and no express or implied warranties or guarantees are made. This material and any view or comment expressed herein are provided for informational purposes only and should not be construed in any way as an inducement or recommendation to buy or sell products, commodity futures or options contracts.


