Today’s Market Trend
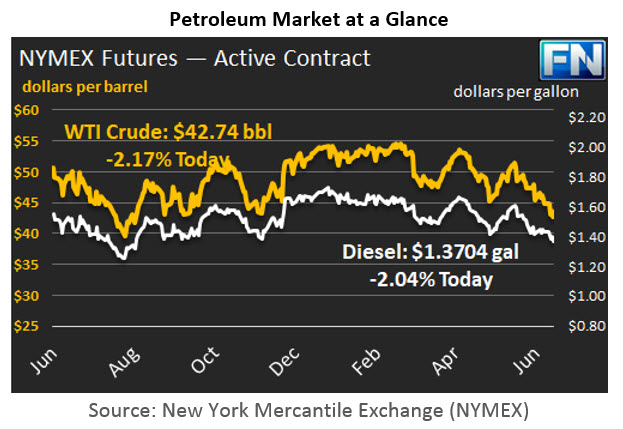
WTI crude prices are approximately $42.75/b this morning, stabilizing after another sharp drop yesterday. Prices continued slide yesterday, closing at $42.53/b, the lowest closing price since August 10, 2016. WTI opened at $42.55/b today, a drop of $0.83, or 1.91%, below yesterday’s opening price. Prices are trending back up slightly, and WTI is currently $42.74/b, up by $0.21 from yesterday’s closing price.
Diesel opened at $1.3619/gallon this morning. This was a drop of 2.95 cents (2.12%) below yesterday’s opening price. Current prices are $1.3704/gallon, up by 0.56 cents from yesterday’s closing price.
Gasoline opened at $1.4112/gallon today, a drop of 1.16 cents, or 0.82%, from yesterday’s opening. Prices are $1.4208/gallon currently, a recovery of 1.03 cents from yesterday’s close.
The Energy Information Administration (EIA) released the official weekly supply data yesterday. The bottom line was far less bearish than it could have been, yet the price response was lukewarm and short-lived. Prices dropped again, then appeared to hit bottom at approximately $42.25/b.
The EIA data on crude inventories showed a stock draw of 2.451 mmbbls, in line with the 2.72 mmbbls drop predicted by the American Petroleum Institute (API.) The EIA reported a distillate stock build of 1.079 mmbbls, below the API’s expectation of 1.84 mmbbls. The EIA also reported a gasoline stock draw of 0.578 mmbbls, in contrast with the API’s report showing a gasoline stock build of 0.346 mmbbls. Nonetheless, buying interest crept up only briefly, and the downward price trend re-asserted itself.
The EIA data also reported a bounce-back in gasoline demand during the week ended June 16th, alleviating a serious collapse in apparent demand during the week ended June 2nd and the week ended June 9th. During the first two weeks of June, apparent gasoline demand averaged 9293 kbps, more than 300 kbpd below the May average of 9596 kbpd. The new weekly data brought the average demand level up to 9467 kbpd. This still was 129 kbpd below May’s average demand, but the market could view it as a step in the right direction.
During the first three weeks of June, U.S. refiner net input of crude oil averaged nearly 17,212 kbpd, up by nearly 44 kbpd from May’s average crude input. Refinery crude runs have hit record-high levels recently. The EIA’s analysis follows as our second article today.
This article is part of Crude
MARKET CONDITION REPORT - DISCLAIMER
The information contained herein is derived from sources believed to be reliable; however, this information is not guaranteed as to its accuracy or completeness. Furthermore, no responsibility is assumed for use of this material and no express or implied warranties or guarantees are made. This material and any view or comment expressed herein are provided for informational purposes only and should not be construed in any way as an inducement or recommendation to buy or sell products, commodity futures or options contracts.


