

U.S. Rig Count Rebounding
Analysis by Dr. Nancy Yamaguchi
The oil price war took a massive toll on the active rig count in the U.S. In 2015, the active rig count fell by over 60%, dropping from 1,840 rigs at the end of 2014 to 698 rigs at the end of 2015. Another 234 rigs dropped out during the first quarter of 2016.
The declining rig count bottomed out at 404 active rigs at the end of May, 2016. Since then, oil rigs have been slowly and steadily tempted back into the field. At the start of the fourth quarter of 2016, there were 522 active rigs, and by the end of the 2016, there were 658—nearly as many as there were at the beginning of the year.
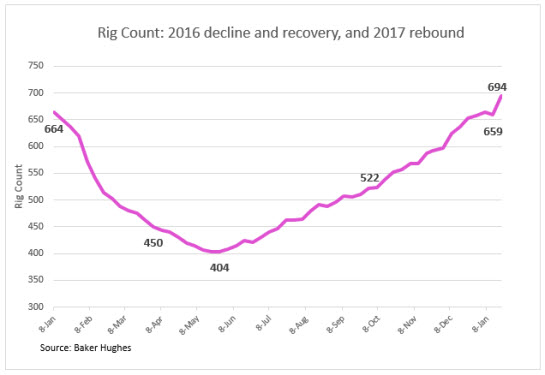
Between mid-September and the end of December, the active rig count increased every week except for one. As we moved into January 2017, the rig count dropped by 6 for the week ended January 13, 2017. This was caused by the vertical rig count dropping by 11, offsetting an increase of 3 horizontal rigs. However, the Baker Hughes rig count jumped by 35 during the week ended January 20, 2017, including a replacement of 12 vertical rigs. The rig count as of the week ended January 20, 2017 was 694, a full 30 rigs higher than it was at the beginning of 2016.
The rebound of the rig count looks more modest, however, when placed in a longer time horizon. The figure below shows the Baker Hughes weekly rig count beginning in January 1991 and going through the week ended January 20th, 2017. This shows the dramatic growth in the rig count as progress was made in horizontal drilling during the mid-2000s. The rig count rose from around 750 in early 2002 to over 2,000 in 2008. As readers will recall, oil prices had spiked above $100/b that summer. As the U.S. toppled into recession, the rig count plummeted below 900 in 2009. The rig count began to recover, and it passed the 2,000 mark again in the fourth quarter of 2011.
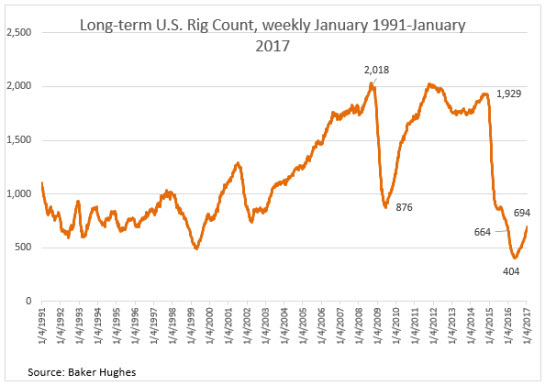
The oil price war was launched in late 2013. It wore down the rig count, which fell to a low of 404 in May 2016. This was the lowest number of active rigs reported in the series extending back to 1991. The current rig count rebound to 694 indicates that additional production is forthcoming. It would be surprising, however, to see a steady climb back to 2000 rigs. Even the most bullish oil price forecasts today hesitate to go past $60/b this calendar year. If the coming months bring an equilibrium oil price of $50-$55/b, the U.S. upstream industry may also reach an equilibrium point, and rig reactivations may begin to slow down. The rig count is responsive to price, and as always, markets will be back-and-forth as the market assesses the level of OPEC compliance in the coming six months.
This article is part of Daily Natural Gas Newsletter
MARKET CONDITION REPORT - DISCLAIMER
The information contained herein is derived from sources believed to be reliable; however, this information is not guaranteed as to its accuracy or completeness. Furthermore, no responsibility is assumed for use of this material and no express or implied warranties or guarantees are made. This material and any view or comment expressed herein are provided for informational purposes only and should not be construed in any way as an inducement or recommendation to buy or sell products, commodity futures or options contracts.


