

Monthly Midwest Crude Oil Imports Surpassed Gulf Coast Crude Oil Imports for First Time
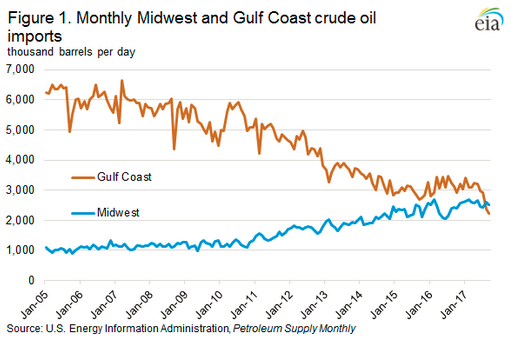
In August, monthly U.S. imports of crude oil coming into the Midwest (Petroleum Administrative Defense District (PADD) 2) exceeded imports of crude oil into the Gulf Coast (PADD 3) for the first time since the U.S. Energy Information Administration began keeping records in 1981. Although Hurricane Harvey disrupting Gulf Coast port operations and temporarily limiting imports was a primary factor in this reversal, which continued in September, other long-term trends contributed as well. Specifically, imports of crude oil into the Gulf Coast have been decreasing over the past 10 years, and imports into the Midwest have been increasing over the same period. These long-term trends narrowed the difference in imports between the two regions and contributed to the reversal in the historical relationship after Hurricane Harvey (Figure 1).
The long-term increases of crude oil availability in the Midwest from domestic and Canadian sources have led to evolving trade and supply patterns, both domestically and internationally. Historically, the Midwest received crude oil from the Gulf Coast, including both domestically produced crude oil and imports that were received by ports in the Gulf Coast, then sent via pipeline to the Midwest for processing. Despite increasing gross inputs into refineries, the Midwest has reduced its reliance on both domestic crude oil shipments and foreign imports sent from the Gulf Coast, while imports into the Midwest from Canada have increased.
As U.S. crude oil production has increased, foreign crude oil imports have decreased. Total U.S. crude oil imports fell from 10.1 million barrels per day (b/d) in 2005 to 7.9 million b/d in 2016. However, from 2005 to 2016, imports from Canada (the largest single supplier of crude oil to the United States) grew from 1.6 million b/d to 3.2 million b/d, while imports from Saudi Arabia (the second-largest source of U.S. crude oil imports) fell from 1.4 million b/d to 1.1 million b/d. Most of the crude oil imports from Canada are processed in Midwest refineries, while most of the Saudi imports are processed in Gulf Coast refineries.
Total crude oil imports into the Midwest began increasing sharply between 2010 and 2011, and imports into the Gulf Coast began decreasing at about the same time. These trends led to a narrowing of the differential in crude oil import volumes between the two regions.
Midwest refining capacity has expanded, driven by proximity to increasing and cost-advantaged North American crude oil streams, including production from the Bakken Formation in North Dakota and Montana and from the Alberta Oil Sands in Western Canada. From 2005 to 2016, Midwest refining capacity increased by 370,000 b/d to 3.9 million b/d. As of September 2017, Midwest refining capacity was 4.0 million b/d. The increased availability of crude oil in the Midwest and Canada has decreased the need for foreign imports moved through the Gulf Coast to supply expanding Midwest refineries. As a result, imports of Saudi crude oil into the Midwest for processing fell from 132,000 b/d in 2005 to 39,000 b/d in 2016. The drop in Saudi crude oil processed in Midwest refineries has contributed to decreasing movements of crude oil from the Gulf Coast to the Midwest.
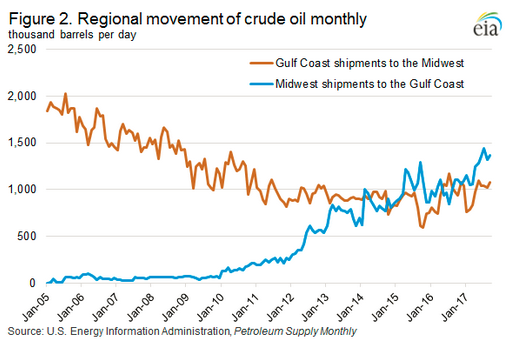
As the availability of crude oil in the Midwest and imports from Canada into the Midwest both increased, movement of crude oil from the Gulf Coast to the Midwest declined. From 2005 to 2016, Midwest receipts from the Gulf Coast fell from 1.8 million b/d to 968,000 b/d. Over the same period, volumes of crude oil moved from the Midwest to the Gulf Coast increased, with Gulf Coast receipts from the Midwest growing from 37,000 b/d in 2005 to 1.0 million b/d in 2016 (Figure 2). This shift was facilitated by infrastructure projects including the reversal and expansion of the Seaway pipeline to bring both domestic and foreign crude oil from Cushing, Oklahoma to the Houston, Texas area.
The long-term trends of rising crude oil import volumes into the Midwest and decreasing import volumes into the Gulf Coast were magnified by the effects of hurricanes this year. On August 25, Hurricane Harvey made landfall in Texas as a Category 4 hurricane, causing port closures and substantial disruptions to crude oil and petroleum product supply chains. As a result, crude oil imports into the Gulf Coast fell from 3.4 million b/d for the week before the hurricane to 1.5 million b/d for the week after the hurricane (Figure 3). Hurricane Harvey also contributed to Gulf Coast refinery disruptions as gross inputs to refineries fell from 9.3 million b/d for the week before the hurricane to 6.2 million b/d for the week following the hurricane. Crude oil imports into the Gulf Coast have since recovered to 2.3 million b/d for the week of November 24. Refinery activity in the Gulf Coast has also recovered, as gross inputs averaged 9.2 million b/d as of November 24, or 625,000 b/d more than the previous five-year average for that time of year.

Hurricane Harvey did not reduce foreign imports into the Midwest. Crude oil imports into the Midwest the week before Hurricane Harvey were 2.5 million b/d and surpassed crude oil imports into the Gulf Coast for eight consecutive weeks, remaining between 2.4 million b/d and 2.7 million b/d each week. Since then, no clear trend regarding which region imports greater volumes of crude oil has emerged. Although greater imports of crude oil into the Midwest than into the Gulf Coast was historically atypical, continuing increases in U.S. and Canadian crude oil production mean that higher imports of crude oil into the Midwest than into the Gulf Coast could become a more frequent phenomenon.
This article is part of Crude
Tagged:
MARKET CONDITION REPORT - DISCLAIMER
The information contained herein is derived from sources believed to be reliable; however, this information is not guaranteed as to its accuracy or completeness. Furthermore, no responsibility is assumed for use of this material and no express or implied warranties or guarantees are made. This material and any view or comment expressed herein are provided for informational purposes only and should not be construed in any way as an inducement or recommendation to buy or sell products, commodity futures or options contracts.


