

EIA Short-Term Energy Outlook – August 2017
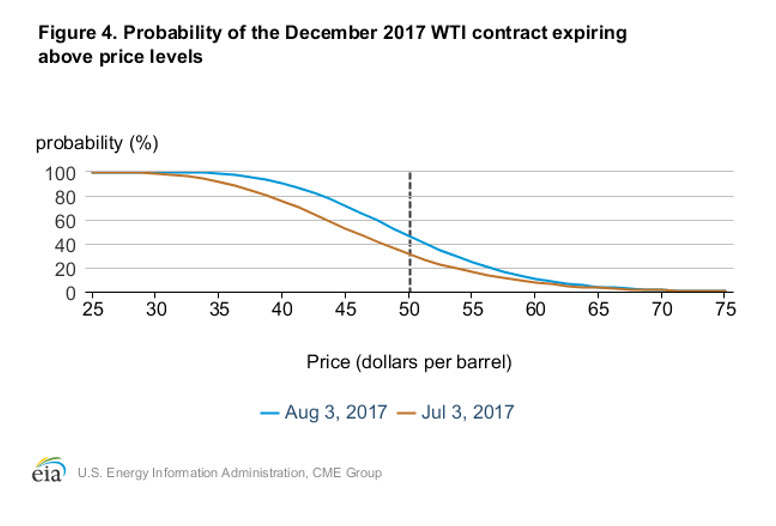
Editor’s Note: Each month the EIA updates its Short-Term Energy Outlook, providing insights into market trends. Of particular interest this quarter is Figure 4, which gives the probability of December prices reaching various price levels. Tomorrow, we’ll share the EIA’s refined product outlook.
Prices: Crude oil benchmark Brent front-month futures prices increased by $2.33 per barrel (b) from July 3, settling at $52.01/b on August 3. The West Texas Intermediate (WTI) crude oil price increased by $1.96/b during the same period, settling at $49.03/b (Figure 1). Brent and WTI monthly average spot prices in July were $2.11/b and $1.45/b higher, respectively, than the June averages.

Crude oil prices increased in response to supply-side factors as well as strong U.S. refinery demand. Total commercial crude oil and petroleum product inventories in the United States fell by 22.4 million barrels from June 30 to July 28, compared with a five-year average inventory build of 5.9 million barrels over that period. Also, drilling activity in the United States, as measured by the Baker Hughes active oil rig count, increased by 10 rigs in July, the fewest monthly oil rig additions since the rig count began increasing in June 2016. Some U.S. exploration and production companies recently announced less investment spending for the rest of the year, suggesting the current rate of U.S. oil production growth could slow. EIA forecasts that month-over-month crude oil production increases for the Lower 48 states onshore region will slow to an average of 60,000 barrels per day (b/d) in the second half of 2017, compared with estimated average monthly growth of 110,000 b/d in the first half of the year.
Crude oil prices were further supported as the Organization of the Petroleum Exporting Countries (OPEC) member Saudi Arabia announced a cap on the country’s crude oil exports in August. However, it is unclear how much extra crude oil this cap would remove from the market given the country’s typical seasonal decline in crude oil exports because of an increase in crude oil use for power generation. However, Libya and Nigeria, two other OPEC members, continue to increase crude oil production, a contributing factor in keeping prices near $50/b.
Global economic growth expectations remain supportive of liquid fuels demand growth. Second-quarter Gross Domestic Product grew 2.6% at a seasonally adjusted annual rate in the United States and grew 6.9% and 2.1% year-over-year in China and the Eurozone, respectively. Furthermore, global inflation data remain below targets set by the major central banks, allowing the continuation of generally accommodative monetary conditions. EIA forecasts global liquid fuels consumption to grow by 1.4 million b/d in 2017 and by 1.6 million b/d in 2018.
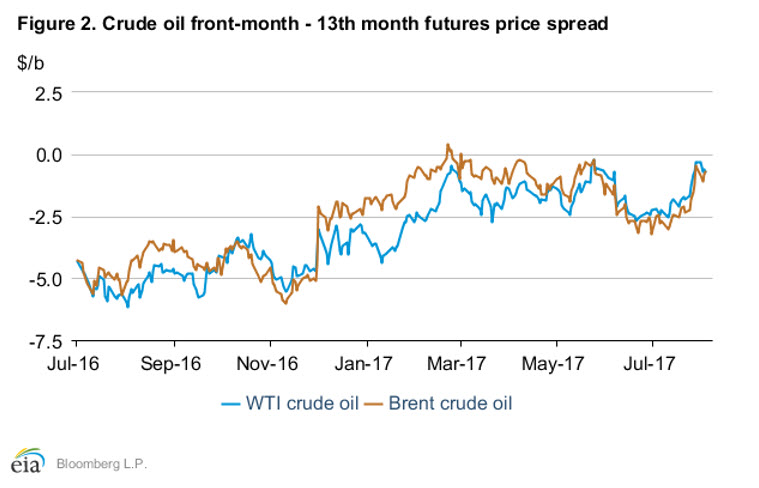
Strong oil inventory draws have likely caused front-month futures prices to increase more than prices for contracts for delivery further in the future. Contango (when near-term prices are lower than longer-dated ones) narrowed significantly in the past month. The Brent and WTI 1st-13th spread increased $1.78/b and $1.47/b, respectively, from July 3 to August 3, settling at -73 cents/b and -72 cents/b, respectively (Figure 2).
In July, total commercial petroleum inventories in the Organization for Economic Cooperation and Development (OECD) countries are estimated to have declined by the most year-over-year since April 2014. In the United States, commercial crude oil stocks fell to 481.9 million barrels on the week ending July 28, which was 95.0 million barrels above the five-year average. In recent weeks, U.S. crude oil inventories reached the closest to the five-year average since September 2015. U.S. refineries have been running at record highs this year, with crude oil inputs averaging 17.3 million b/d for the four weeks ending July 28, contributing to the inventory decline and the flattening crude oil futures price curve.
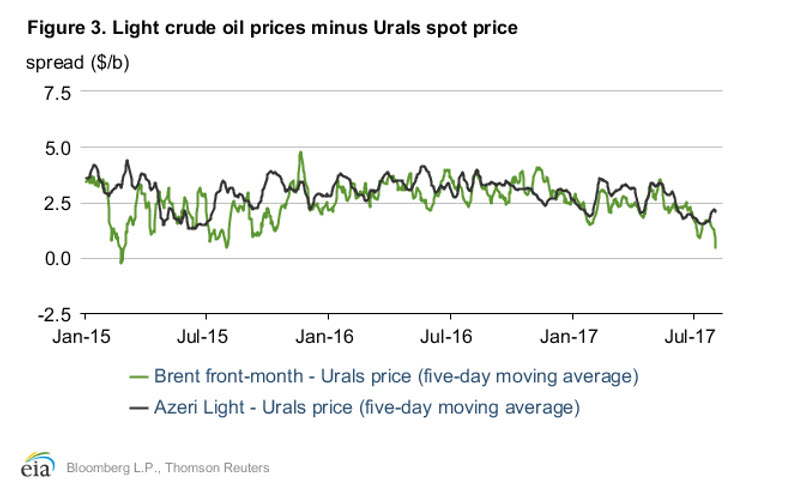
Crude oil quality differentials: The OPEC and non-OPEC crude oil voluntary production cuts resulted primarily in less medium, sour and heavy, sour crude oils on the global market. As a result, over the past several months, the usual premium that light, sweet crude oils command over medium and heavy crude oils has declined in many regions around the world. Prices for Urals crude oil, a medium, sour crude oil produced in Russia and priced in the Mediterranean region, have increased in July compared with prices for lighter crude oils (Figure 3). The average monthly spread between the Brent front-month price and Urals spot price declined from $2.63/b in May to $1.35/b in July. Similarly, the average monthly price spread between Azeri Light, a light crude oil produced in Azerbaijan, and Urals declined from $3.05/b to $1.73/b over the same period.
Trade press reports indicate that less crude oil is being exported from Saudi Arabia to Europe, which may be supporting prices of crude oils like Urals, which are similar in quality to Saudi Arabian crude oil. Less Urals crude oil exported into the European region may also be supporting Urals prices, as one of the pipelines that transports Urals crude oil for export from the Baltic Sea is being converted to transport diesel. At the same time, higher crude oil production in Libya, Nigeria, and the United States is adding additional light, sweet crude oil into the market and could be contributing to a narrower price spread between light and medium crude oils.
Market-derived probabilities: The December 2017 WTI futures contract averaged $49.90/b for the five trading days ending August 3 and has a market-derived probability of exceeding $50/b of 46% (Figure 4). This contract had a 31% market-derived probability of exceeding $50/b as of July 3. Larger than expected inventory withdrawals and petroleum demand reported in the Weekly Petroleum Status Report (WPSR) could have contributed to an increase in market expectations of WTI prices ending the year above $50/b.
This article is part of Crude
Tagged:
MARKET CONDITION REPORT - DISCLAIMER
The information contained herein is derived from sources believed to be reliable; however, this information is not guaranteed as to its accuracy or completeness. Furthermore, no responsibility is assumed for use of this material and no express or implied warranties or guarantees are made. This material and any view or comment expressed herein are provided for informational purposes only and should not be construed in any way as an inducement or recommendation to buy or sell products, commodity futures or options contracts.


