Diesel Demand 2016: Comparing Weekly, Monthly, and Annual Trends
by Dr. Nancy Yamaguchi
This examination of U.S. diesel demand in 2016 is a companion piece to our recent article on gasoline demand. The Energy Information Administration (EIA) is the official source of information on national petroleum supply. Measuring fuel consumption is not an exact science, but the EIA provides annual, monthly, and weekly data, and it is the most widely used and cited source. The recent release of December 2016 data now allows us to create an average for the full year of 2016. We then can view the long-term trend in annual data, plus mid-term trends in the monthly data. We also can assess the short-term trends seen in the weekly supply data, and we can compare how the official monthly data compares with the monthly averages gleaned from the weekly preliminary data. In our gasoline analysis, we discovered an interesting seasonal pattern: the weekly data usually under-reported gasoline demand in the winter months and over-reported it in the summer months. Can we detect a similar pattern in the diesel data? How do we work with this data to shed light on where demand will head in the first quarter of 2017?
The EIA publishes monthly data with a two-month lag. The final annual data is published with a nine-month lag. The market looks to the weekly demand figures for the timeliest guidance. Logically, the weekly ups and downs should average out to be a reasonable approximation for monthly demand. But we found that this is not always the case.
Figure 1 tracks the course of the monthly diesel supply estimates for the five weeks of December, 2016. These weekly estimates ranged from 2792 kbpd to 4549 kbpd. Averaging the five weekly data estimates provides a monthly consumption average of 3808 kbpd. The official monthly data, however, now places December diesel consumption at 4059 kbpd, which is 251 kbpd higher than the weekly data suggests.
In the case of gasoline, there appeared to be a seasonal influence: the weekly estimates tended to understate demand in the winter months, and overstate it in the summer months. Figure 2 compares the weekly and monthly data for July 2016 to see whether this relationship was similar. In the case of diesel, the weekly supply data averaged to 3704 kbpd, whereas the monthly data reported demand at 3578 kbpd. The weekly data suggested that demand was 126 kbpd higher than the monthly data reported. There may be a slight seasonal effect in the weekly diesel data as well, but it appears more muted than the one seen in the gasoline data series.
Figure 3 presents the long-term trend in U.S. diesel demand on an average annual basis, 2000 through 2016. As was the case with gasoline also, the recession had a severe impact on diesel demand. Diesel demand dropped from 4196 kbpd in 2007 to 3945 kbpd in 2008, and it dropped even further to 3631 kbpd in 2009. Diesel demand then cycled up and down between approximately 3600 kbpd and 3900 kbpd for the next five years until 2014, when it reached 4010 kbpd. This was the first time diesel demand had topped the 4-million-barrel-per-day mark since 2007. But diesel demand has never returned to its prior levels. In 2015, diesel demand declined slightly to 3995 kbpd. The new EIA data shows that demand fell again to 3878 kbpd in 2016. This is a stark contrast to the trend in gasoline demand, which soared from 2012 through 2016.
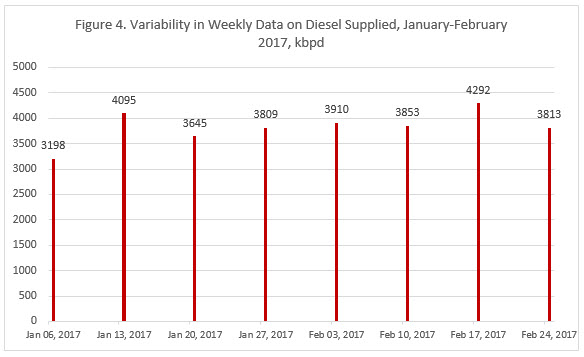
Figure 4 shows the weekly estimates of diesel supplied for the first eight weeks of 2017. Diesel demand was reported at just 3198 kbpd during the week ended January 6th, lower than it was on average in any year from 2000 through 2016. Apparent demand was reported as high as 4292 kbpd during the week ended February 17th. This was higher than it was on average in any year from 2000 through 2016. It dropped again to 3813 kbpd the next week. In the eight weeks of data available on diesel demand in 2017, demand has varied by over a million barrels per day, ranging from 3809 kbpd to 4292 kbpd.
Conclusion: 1st quarter weakness in gasoline demand, strength in diesel demand
There is huge variability in the weekly estimates of diesel demand, just as there was with gasoline demand. Simple extrapolation of trends is not useful as a forecasting methodology. Nonetheless, the EIA data is immensely useful in understanding the direction of demand when we compare short, medium, and long-term data. The data on gasoline suggested that January and February 2017 demand is below the expected norm. The data on diesel suggest that demand is above the norm. All other things being equal, the steep upward trend in gasoline demand growth seen between 2012 and 2016 is leveling off, and the steep downward trend in diesel is leveling off as well. The coming weeks and months will test our theory: when the final data for the first quarter of 2017 become available (in late-May or early June,) gasoline demand will be weak, and diesel demand will be strong.
This article is part of Diesel
Tagged:
MARKET CONDITION REPORT - DISCLAIMER
The information contained herein is derived from sources believed to be reliable; however, this information is not guaranteed as to its accuracy or completeness. Furthermore, no responsibility is assumed for use of this material and no express or implied warranties or guarantees are made. This material and any view or comment expressed herein are provided for informational purposes only and should not be construed in any way as an inducement or recommendation to buy or sell products, commodity futures or options contracts.


