Crude Inventories Are Lower Than You Think
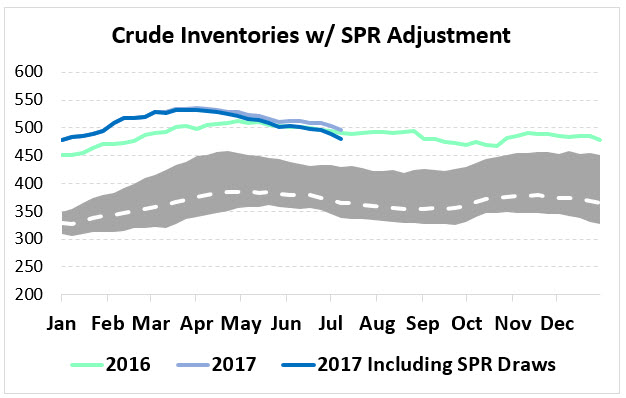
Ever since OPEC announced their cuts in November 2016, markets have grown increasingly reliant on oil inventories to dictate overall market sentiment, giving markets a push one direction or another. With yesterday’s reported crude inventory draw of 7.5 MMbbls, the largest stock draw of the year, the downward price pressure seen earlier this week has lost its hold on the market. Still, despite regular crude inventory draws in the past few months (in the last 14 weeks, we’ve had 12 stock draws totaling -42.6 MMbbls), inventories remain 5 MMbbls above 2016 levels. Or do they?
Most analysts report on commercial crude inventories when they discuss stock movements. Commercial inventory is the total storage available to traditional private actors in the oil industry, including refinery, terminal, tank, and pipeline storage. For years, this has been the main attraction in the EIA’s stock report, pointing to how much excess crude oil exists in the market. Often overlook, however, is U.S. Strategic Petroleum Reserve, which has been held at levels between 690-695 MMbpd since 2011.
AS the U.S. has become a bigger producer of crude inventories, the need to keep such hefty inventories has been reduced. Several different pieces of legislation have mandated withdrawals from the SPR to generate revenues for other projects, which has brought inventories lower. In 2017, roughly 17 MMbbls are scheduled to be sold, rising to 25 MMbbls in 2018.
When sold, SPR inventories go on the market. Recent sales this year were awarded to Shell and Phillips 66, who received product in March and April. Already this year, 16.1 MMbbls have been taken out of SPR inventories.
If the government had not chosen to liquidate those inventories, private companies would have had to pull product from existing stocks. Remember above when I said crude inventories were still 4 MMbbls above 2016 levels? If you subtract the 16.1 MMbbls of SPR crude oil added to the market, crude inventories in the U.S. would have been at 479 MMbbls — 12 MMbbls under 2016 levels.
What does this mean? Well, first, it’s important to note that those SPR inventories are on the market, so even though they’re unusual, they have added to overall supply. That’s why markets are not rising quite so fast despite inventory draws.
Second, SPR sales are expected to continue for a while. As the EIA chart above demonstrates, sales are expected to accelerate in 2018-19, not decelerate, meaning even more product will be flooding the market in the future. SPR sales will help keep markets price action subdued in those years.
Last, this news shows that, absent U.S. SPR withdrawals, OPEC’s cuts may have been effective after all. Had the U.S. not changed courses and sold substantial quantities of oil, inventories would have been declining even more rapidly than we are now. Unfortunately for OPEC (and fortunately for consumers), the SPR sales are a market reality that has stunted OPEC’s efforts.
Next time you read about U.S., Libya, and Nigeria production increases offsetting OPEC’s efforts, keep in mind that there are more factors at play than just current production increases. And those factors go beyond the U.S. – while we’ve been selling, China, South Korea, and India have been taking advantage of low prices to add to their SPRs, bringing more demand to the market. The supply/demand balance goes beyond summer driving season and international production – strategic political decisions can also significantly impact the market. It will be interesting to continue watching how government stocks affect overall inventories and, ultimately, fuel prices.
This article is part of Crude
MARKET CONDITION REPORT - DISCLAIMER
The information contained herein is derived from sources believed to be reliable; however, this information is not guaranteed as to its accuracy or completeness. Furthermore, no responsibility is assumed for use of this material and no express or implied warranties or guarantees are made. This material and any view or comment expressed herein are provided for informational purposes only and should not be construed in any way as an inducement or recommendation to buy or sell products, commodity futures or options contracts.


